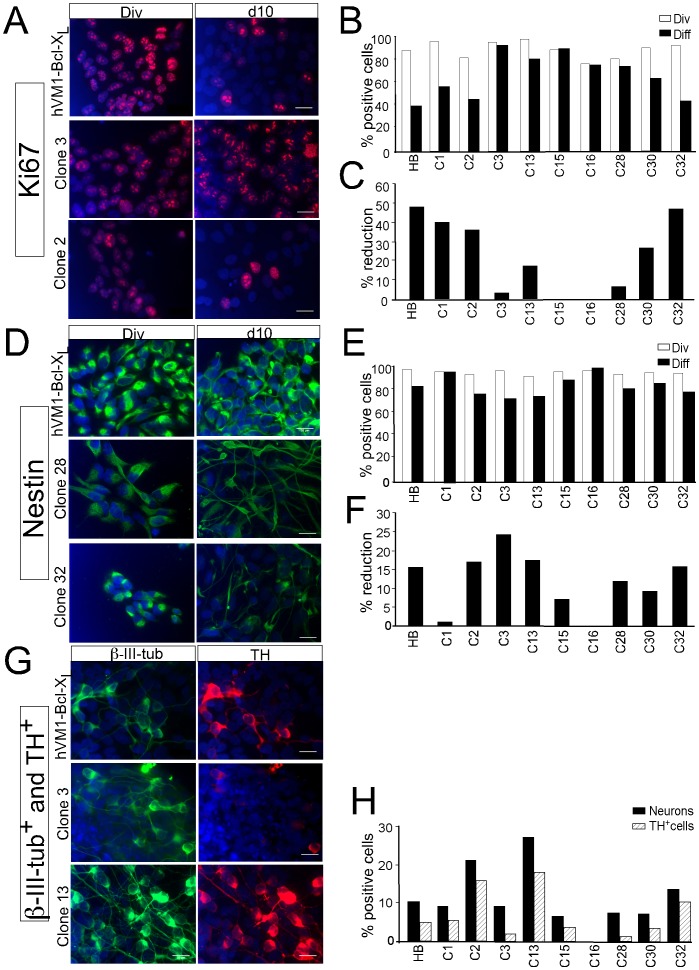
Figure 3. Analysis of Ki-67 and Nestin expression downregulation, and appearance of neuronal markers following differentiation.
Ki-67 (A) and Nestin (D) immunofluorescence of the control hVM1-Bcl-XL cells (HB) and representative clones under division (Div) and following differentiation (d10). In both cases, examples are shown of a clone not showing proper downregulation (#3, 28), and of clones showing good cell cycle exit and disappearance of the NSC marker Nestin (#2, 32). B and E) Quantitative raw data are shown for control HB cells and all clones. C and F) Percentage of reduction in the number of positive cells for each marker. G) Immunofluorescence for β-III-tubulin and TH of the control hVM1-Bcl-XL cells (HB) and representative clones after differentiation (d10). Note the difference in neurogenic and DAn generation capacity for the different clones (H). Clones # 32, 2 and 13 generate more TH+ cells than hVM1-Bcl-XL cells. Clones # 1, 15 and 30 are close to this level. Nuclei were counterstained with Hoechst 33258 (blue). Scale bar: 20 µm, valid for all panels.

