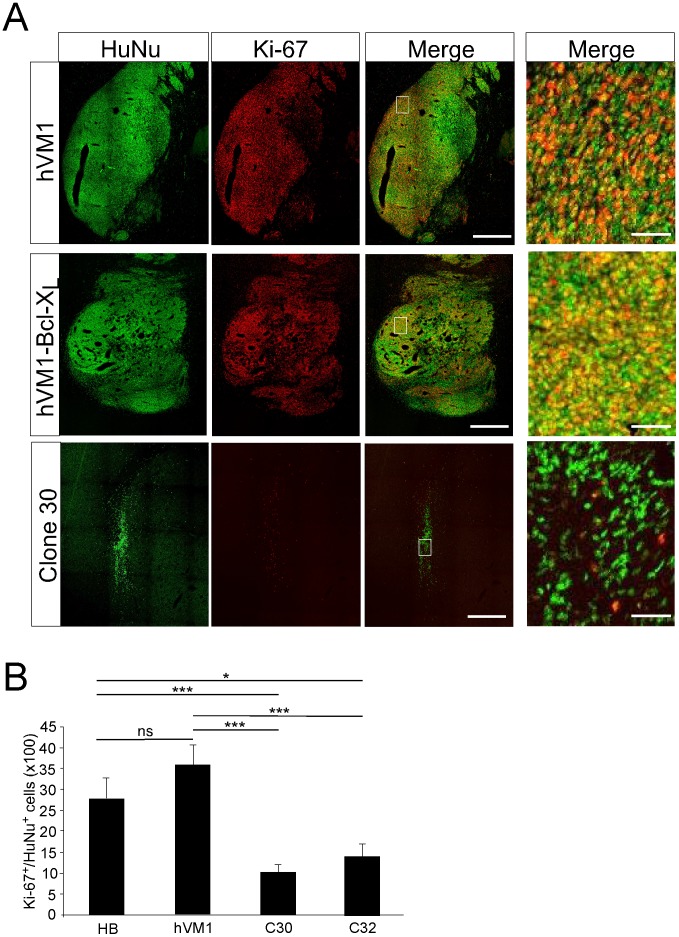
Figure 6. Quantitative analysis of cell cycle exit in transplanted hVM1 cells.
The photomicrographs are z-stack projections of sections stained for HuNu and Ki-67 through transplants of control hVM1 and hVM1-Bcl-XL cells, compared to one of the selected clones (# 30). The images in the right-hand column are high magnifications of the boxed areas to better appreciate individual nuclear staining. Scale bar corresponds to 500 µm (left three columns of images), and 20 µm (right column, high-power views). The histogram at the bottom shows the percentage of human cells (HuNu+) engaged in cell cycle (Ki-67+). Note that Bcl-XL does not change the percentage of proliferating cells, and that both clones are different form the polyclonal lines. Data are expressed as the mean±SEM; *** p<0.001; * p<0.05; ns p>0.05, Student t-Test.

