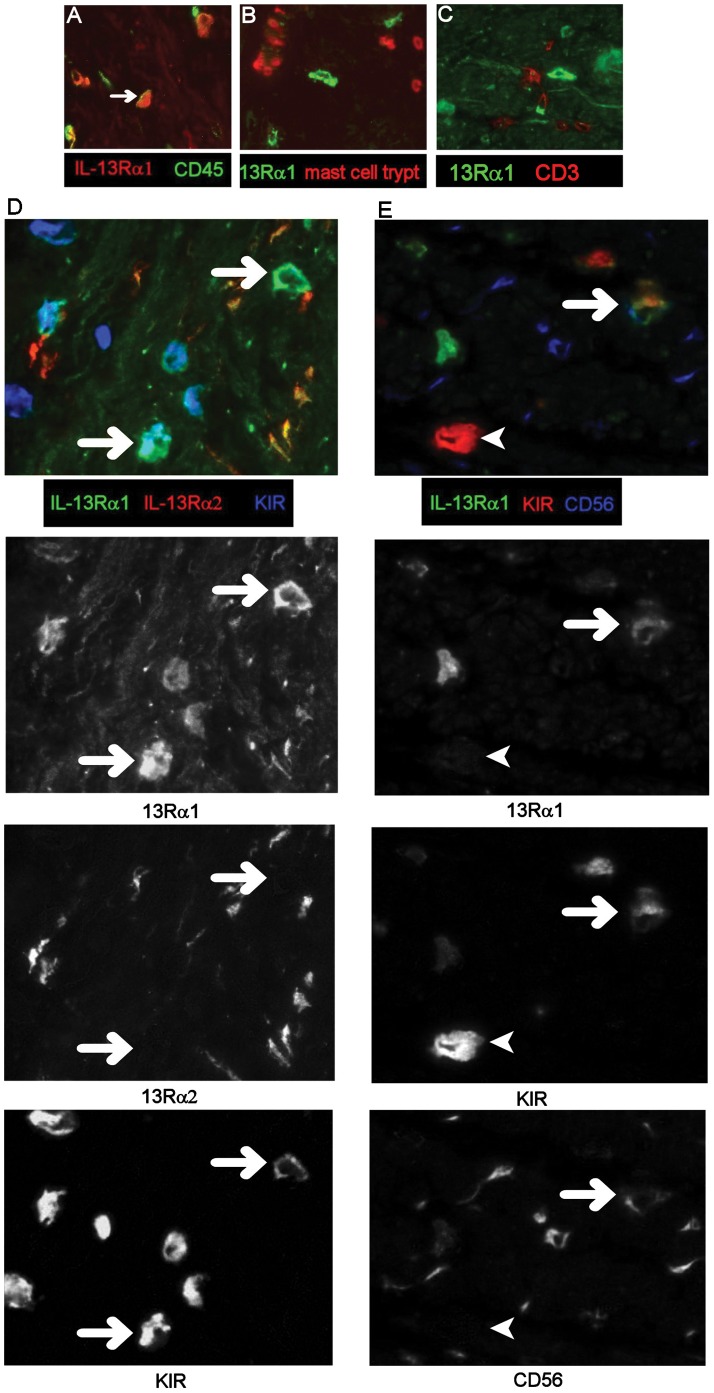
Figure 5. Mononuclear cells expressing very high levels of IL-13Rα1 co-express CD45, KIR and CD56.
Images of frozen, immunostained tissue were captured using a 12 bit monochrome camera and images from the different colour channels combined to form two or three colour images. Multicoloured composites D and E, have been split into their original monochrome images to aid interpretation. Arrows show Rα1 co-localising with other markers. 13Rα1 co-localises with CD45 (A) but not mast cell tryptase (B) or CD3 (C). Panel D, 13Rα1 (green), 13Rα2 (red) and KIR (blue), plus split images for 13Rα1, 13Rα2 and KIR, note that 13Rα2 does not colocalise with 13Rα1+KIR+ cells (arrows). Panel E, 13Rα1 (green), KIR (red) and CD56 (blue). Split image shows a cell expressing all three markers (arrow), note there is also a strongly KIR-expressing cell (bottom left of image) which does not express 13Rα1 or CD56 A–C, ×40 images, D and E, ×64 images. Representative images from 8 patient samples.

