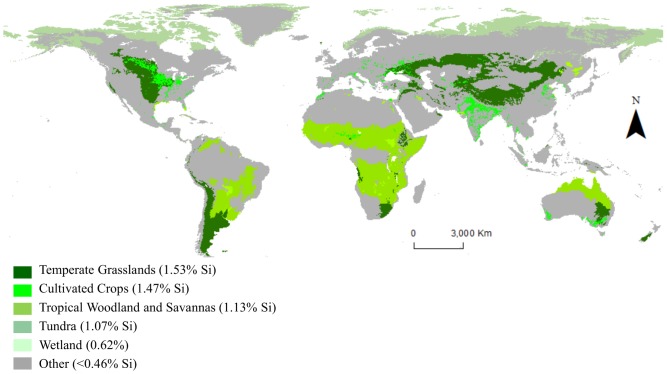
Figure 1. Global land cover by Si accumulating crops.
Shades of green are directly proportional to degree of active Si accumulation (i.e., darker green indicates more Si accumulation). Gray area indicates land cover by biomes of non-active Si accumulators (<0.46% Si by dry wt.) (Table 1). Data from combination of FAO GeoNetwork Global Land Cover Distribution 2007 raster data layer with a resolution of 5-arc minutes, and ESRI, which modified the layer originally created by Olson et al. (2001). Map created using ArcMap 10.0 from ESRI.

