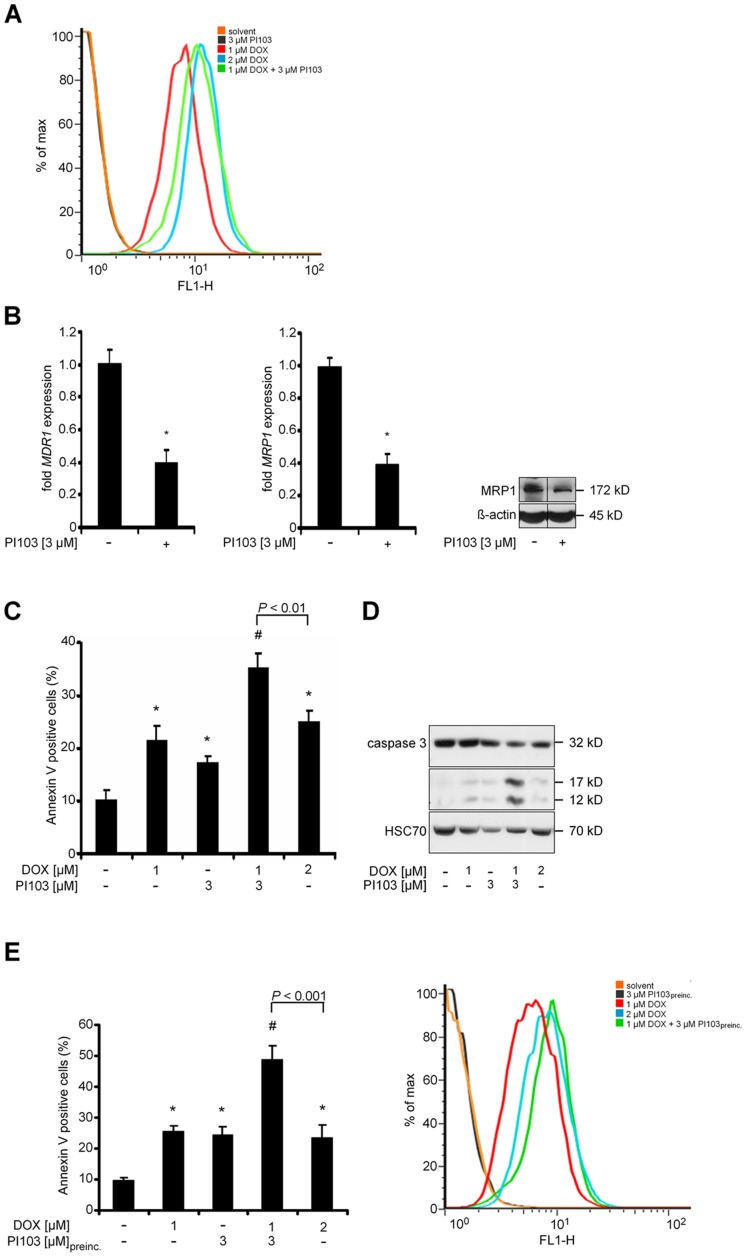
Figure 2. PI103-induced DOX accumulation does not account for cooperative proapoptotic effects in RD cells.
A) Intracellular DOX autofluorescence after treatment with 1 µM DOX (red line), 3 µM PI103 (black line), 2 µM DOX (blue line), 1 µM DOX plus 3 µM PI103 (green line) or solvent (orange line) at 530 nm. The data are expressed as the percentage of the maximum (max) number of positive cells. B) Expression levels of MDR1 (left panel) and MRP1 (middle panel) after treatment with 3 µM PI103 in relation to solvent treated cells (set = 1). Data represent mean+SEM of at least five independent experiments performed in triplicates. *P<0.05 by Students t-test. Protein level of MRP1 after treatment with 3 µM PI103 or the solvent (right panel). C) Annexin V positive RD cells were analysed after treatment with 1 µM DOX, 3 µM PI103, 1 µM DOX plus 3 µM PI103, 2 µM DOX or the solvent. Data represent mean+SEM. Comparisons were made with Students t-test. D) Cells were treated as in C and caspase 3 was assessed by Western blot analyses. E) Annexin V positive RD cells (left panel) and intracellular DOX autofluorescence (right panel) after a 12-hours pretreatment (preinc.) with 3 µM PI103 and subsequent addition of 1 µM DOX for additional 24 h. Annexin V data represent mean+SEM. Comparisons were made with Students t-test.

