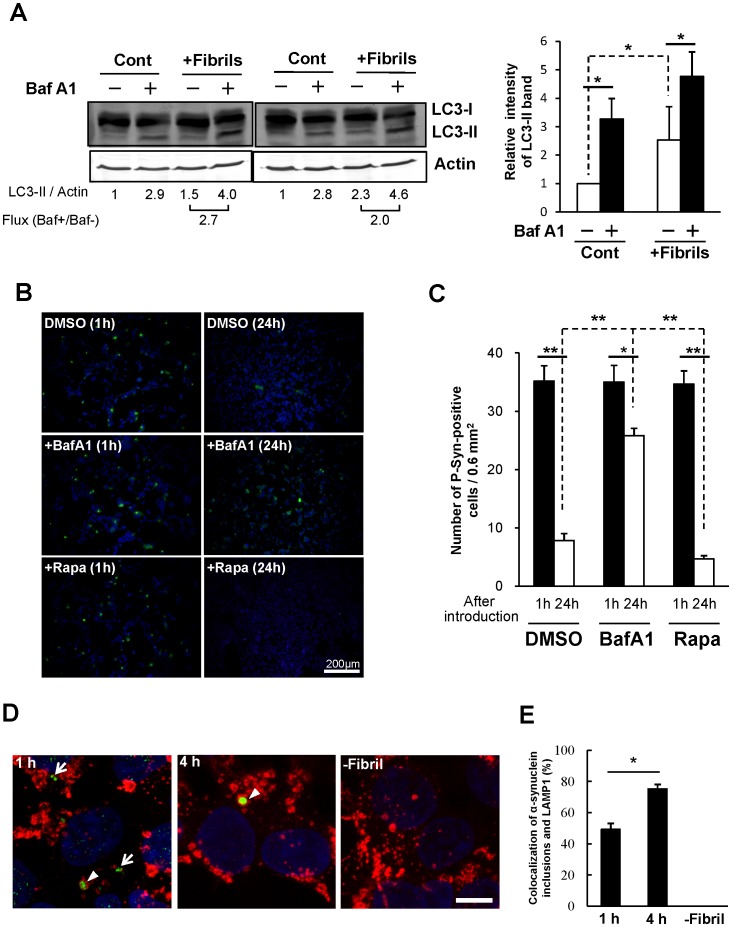
Figure 4. Autophagic clearance of α-synuclein inclusions.
(A) Autophagy flux was analyzed by LC3 protein monitoring. α-Synuclein fibrils-introduced HEK293 cells were treated with (+)/without (−) bafilomycin A1 (BafA1) for 2 h. Cell lysates were subjected to immunoblotting analysis using anti-LC3 (upper panel) or anti-actin (lower panel) antibodies. Quantification of the relative levels of LC3-II/Actin or autophagic flux (Baf+/Baf-) is shown with the ratio. Relative level of LC3-II/Actin was represented by mean ± s.d. as a graph. Statistical analysis was performed with one-way ANOVA (post-hoc Tukey’s test). *p<0.05. This experiment was repeated three times. (B) α-Synuclein fibrils were introduced into HEK293 cells, followed by addition of DMSO, 100 nM bafilomycin (BafA1), or 200 nM rapamycin (Rapa). Cells were stained by anti-phosphorylated α-synuclein antibody (green) and DAPI (blue) 1 h (left panels) or 24 h (right panels) after introduction. (C) The number of phosphorylated α-synuclein-positive cells per unit area (0.6 mm2) was assessed in randomly chosen fields (n = 6). Data represent mean ± s.e.m. Statistical analysis was performed with one-way ANOVA (post-hoc Tukey’s test). *p<0.05, **p<0.001. (D) Colocalization of α-synuclein inclusions and lysosomes. α-Synuclein inclusions (P-αSyn) and lysosomes (LAMP1) were immunostained with anti-phospho-α-synuclein polyclonal antibody (green) and anti-LAMP1 antibody (red) 1 h (left panel) or 4 h (middle panel) after fibril introduction. Fibril-unintroduced cells were used as mock control (right panel). Arrowheads and arrows indicate localized or unlocalized α-synuclein inclusions to lysosomes, respectively. Blue, DAPI. Scale bars, 10 µm. (E) Colocalization of α-synuclein inclusions (n = 41–73) to lysosomes were measured in randomly chosen fields. The experiment was repeated three times. Data represent mean ± s.e.m. Statistical analysis was performed with one-way ANOVA (post-hoc Tukey’s test). *p<0.01.

