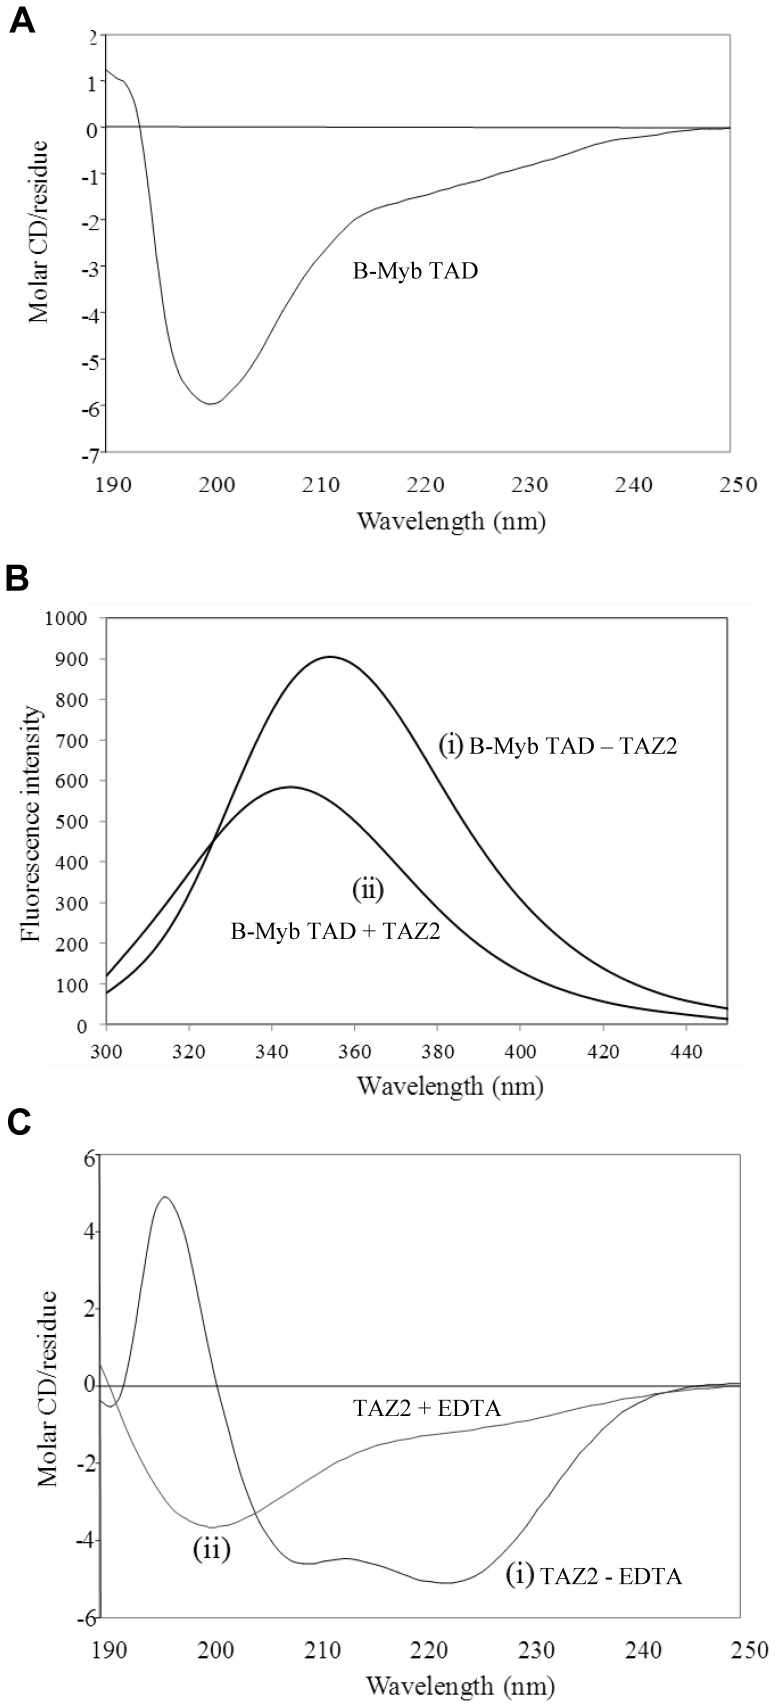
Figure 2. Far UV circular dichroism analysis of the B-Myb TAD and p300 TAZ2 domain.
Panels A illustrates a typical far UV circular dichroism (CD) spectra obtained for the B-Myb TAD. Panel B shows representative intrinsic tryptophan fluorescence emission spectra obtained for the B-Myb TAD in the absence (i) and presence (ii) of an approximately three-fold molar excess of p300 TAZ2. In panel C far UV CD spectra of TAZ2 are shown in the absence (i) and presence (ii) of a molar excess of EDTA over Zn2+ ions.

