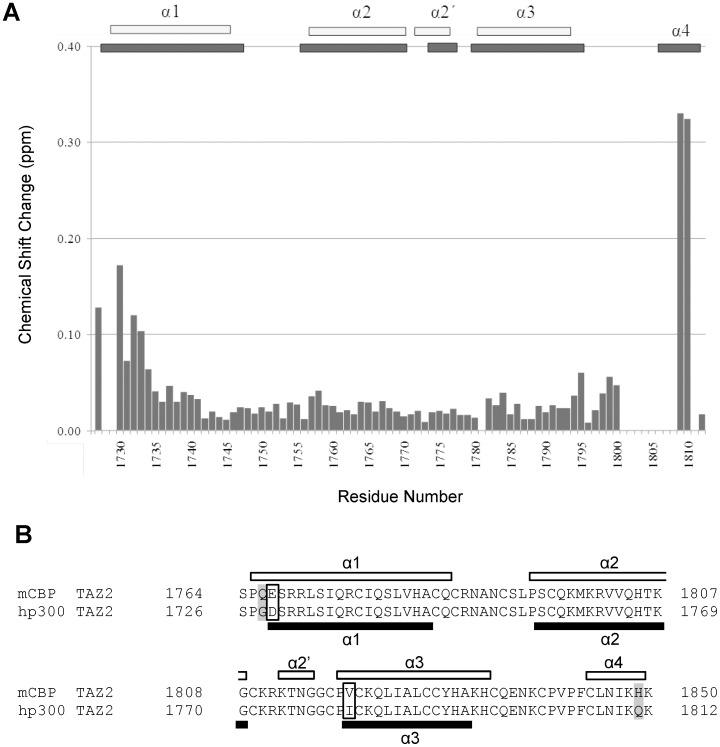
Figure 3. Comparison of NMR assignments and secondary structures for the TAZ2 domains of CBP and p300.
Panel A summarises the combined differences in backbone amide (15N and 1H), CO and Cα chemical shifts for equivalent residues in the TAZ2 domains of CBP and p300. To compensate for the increased chemical shift range of 15N and 13C compared to 1H, the combined change was calculated as (Δ1HN+(Δ15N × 0.2)+(Δ13Cα × 0.1)+(Δ13CO × 0.35))/4. In a very few cases where some of the chemical shifts were not available, the sum of the chemical shift changes was divided by the number of available shift differences. Panel B shows an alignment of the very closely related TAZ2 sequences from CBP and p300. Conservative substitutions are highlighted in an open box and non-conservative highlighted in grey. The black bars shown indicate the positions of the helices in CBP TAZ2 [30], whilst the white bars represent the positions of the helices in p300 TAZ2, which were identified by analysis of the backbone resonance assignments using the chemical shift index method [45].

