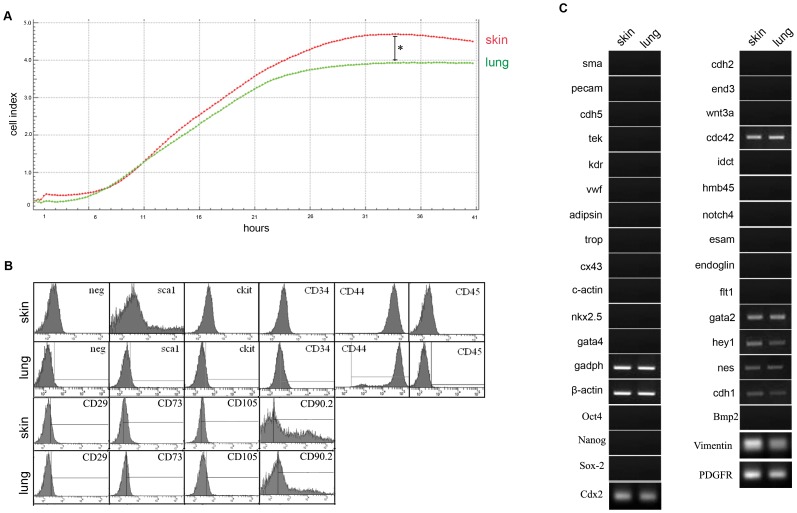
Figure 2. Characterization of skin and lung MPCs.
A. Representative growth curves for skin (red) and lung (green) MPCs in complete medium. One out of nine wells of representative cultures in a Real Time Cell Analyzer is shown. Cell Index represents the relative number of proliferative cells. Differences between skin and lung were statistically significant by ANOVA (*p<0.03). B. Flow cytometry analysis of surface molecule expression on skin and lung mesenchymal precursors. One group of representative histograms out of nine independent experiments is shown. Table 1 shows the media of the mean intensity fluorescence and the variance for all nine experiments. C. RT-PCR analysis of gene expression profile in skin and lung MPCs. The panel shows one representative agarose gel analysis of amplified products out of three independent experiments for each explant. Primer sequences are shown in Table 2 and summary of the results is shown in Table 3.

