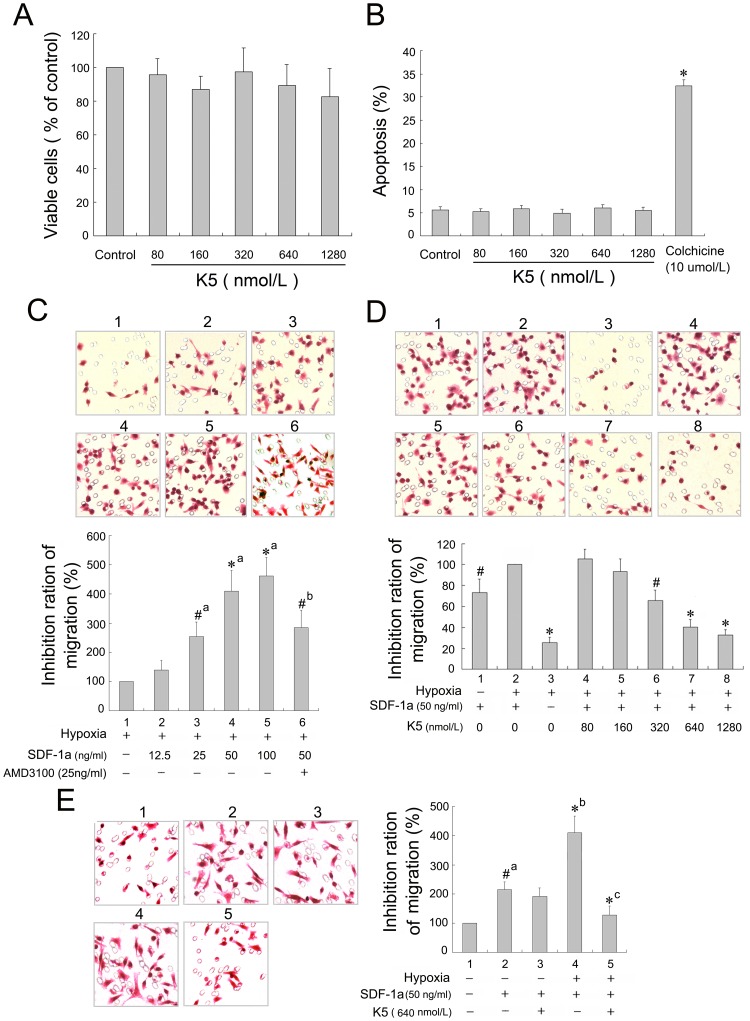
Figure 4. Effect of K5 on the proliferation, apoptosis and migration of LLC cells.
(A) The viable cells were quantified by using the MTT assay and data presented absorbance as percentages of respective controls (means ± SD, n = 3). (B) Apoptotic cells, stained with Annexin V and propidium iodide, were quantified by flow cytometry with the negative control (PBS group) and the positive control (colchicines group) (means ± SD, n = 3, * P<0.01 vs control of group). (C), (D) & (E) The migrated cells were observed in a modified Boyden Chamber assay with HE staining (×400). Data are presented as a percentage of inhibition (n = 3. C, # P<0.05, * P<0.01, a: vs group 1, b: vs group 4. D, # P<0.05, * P<0.01 vs control group 2. E, # P<0.05, * P<0.01, a: vs group 1, b: vs group 3, c: vs group 4).

