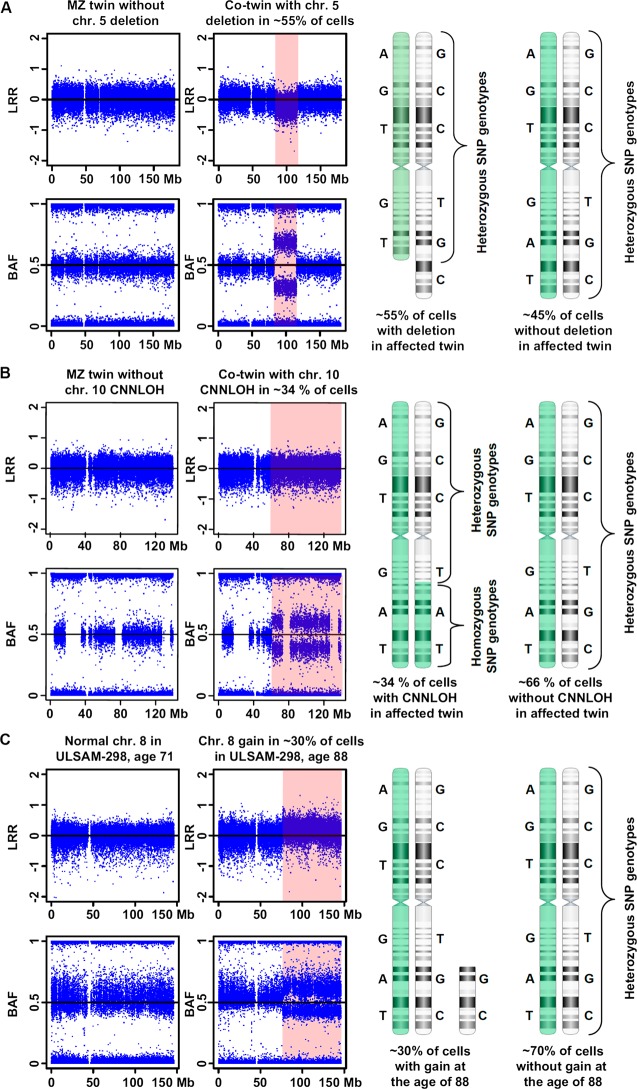
Figure 1.
An illustration of the three main types of post-zygotic structural genetic aberrations, selected from Forsberg et al.1 Panels A, B and C display a deletion, a copy number neutral loss of heterozygosity (CNNLOH, also called acquired uniparental disomy, aUPD), and a gain, respectively. Each panel is composed of images from Illumina single nucleotide polymorphism (SNP) beadchips showing a selected aberrant chromosome, with the affected regions highlighted in pink. The results from Illumina SNP arrays consist of two data tracks: log R ratio (LRR) values of fluorescent intensities from array probes (upper part), and B allele frequency (BAF) values representing the fraction of fluorescent intensity at each SNP accounted for by the B allele (lower part). Normally, BAF values cluster around 0 (AA genotype), 0.5 (AB) or 1 (BB). On the right hand side, a schematic explanatory figure displaying the mosaic mixture of cells with aberrant and wild-type chromosomes is shown. Two hypothetical homologous chromosomes (labelled in green and white) with heterozygous genotypes for six SNPs are shown. Panel A shows data for chromosome 5 in a monozygotic (MZ) twin pair sampled at the age of 77 years. MZ twin TP25-1 has a normal profile, while its co-twin TP25-2 has a 32.5 Mb deletion on 5q in approximately 55% of nucleated blood cells. This deletion is uncovered using both LRR (downward shift) and BAF (heterozygous SNPs cluster away from 0.5) data from the Illumina SNP array. The Illumina profile contains a mixture of genotypes from aberrant cells (approximately 55%) and wild-type cells representing approximately 45% of nucleated blood cells. Panel B shows data for chromosome 10 in MZ twin pair sampled at the age of 77 years. Twin TP12-1 shows a normal profile. Using BAF values a 76.5 Mb large CNNLOH/aUPD was identified on 10q in co-twin TP12-2. Quantification of cells containing the CNNLOH/aUPD suggests that 34% of cells are affected. As this aberration does not change the copy number of the aberrant segment, LRR values are normal. However, the genotypes of SNPs within this segment are all homozygous in aberrant cells. Panel C shows data for chromosome 8 from subject ULSAM-298 using two samples collected at the ages of 71 and 88 years. The sample collected at 71 years shows a normal profile, while the sample taken at the age of 88 years shows a 70 Mb gain of chromosome 8 in approximately 30% of cells, visible with both LRR and BAF data from the Illumina SNP array.

