
Fig. 2.
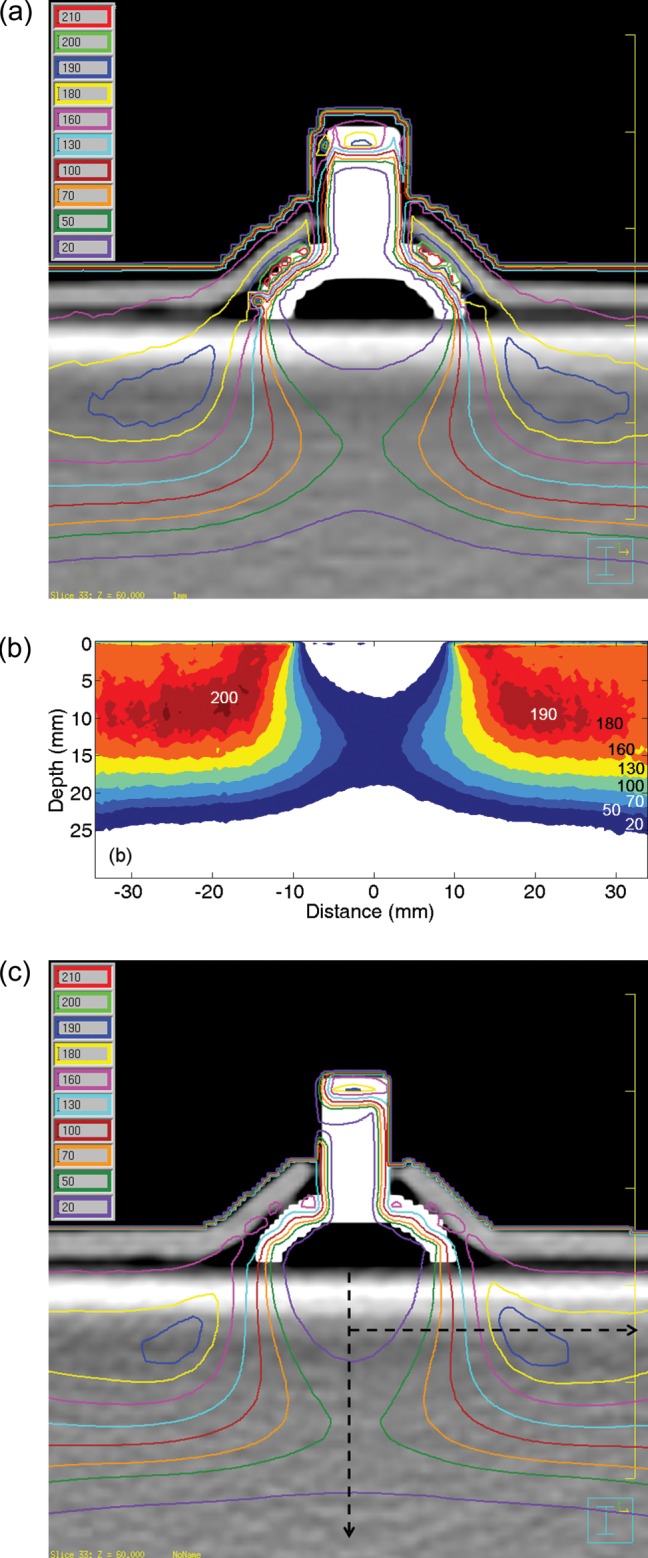
(a) MC simulation results with the modified CT images at the isocenter plane. (b) The EBT2 film results below the eye shield. Legends for dose values are added. (c) Pinnacle plan results with the same modified CT images. Analysis was conducted for the right half, assuming symmetric.