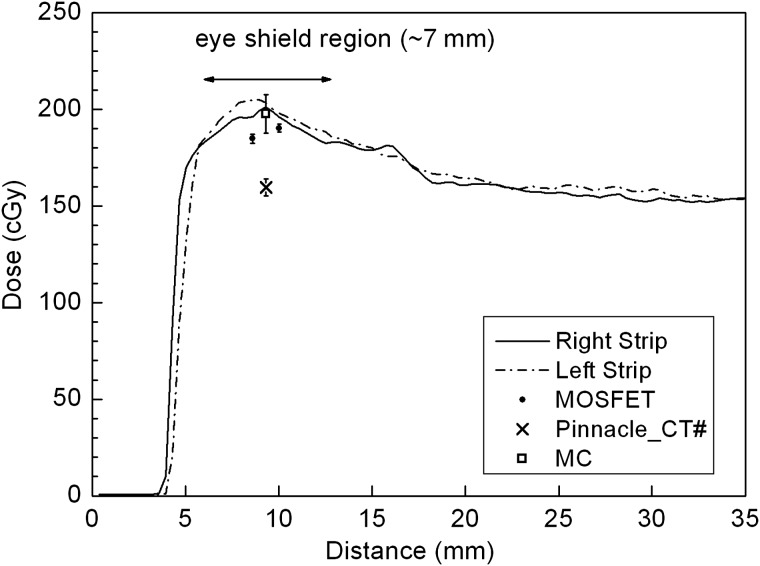
Fig. 4.
Dose comparison at the inner surface of the eyelid. The MC simulation result shows good agreement with the right EBT2 strip (also with the left EBT2) and superior-inferior MOSFET measurements. The Pinnacle PB calculations on the modified CT images (Pinnacle_CT#) underestimate the dose by 20%.

