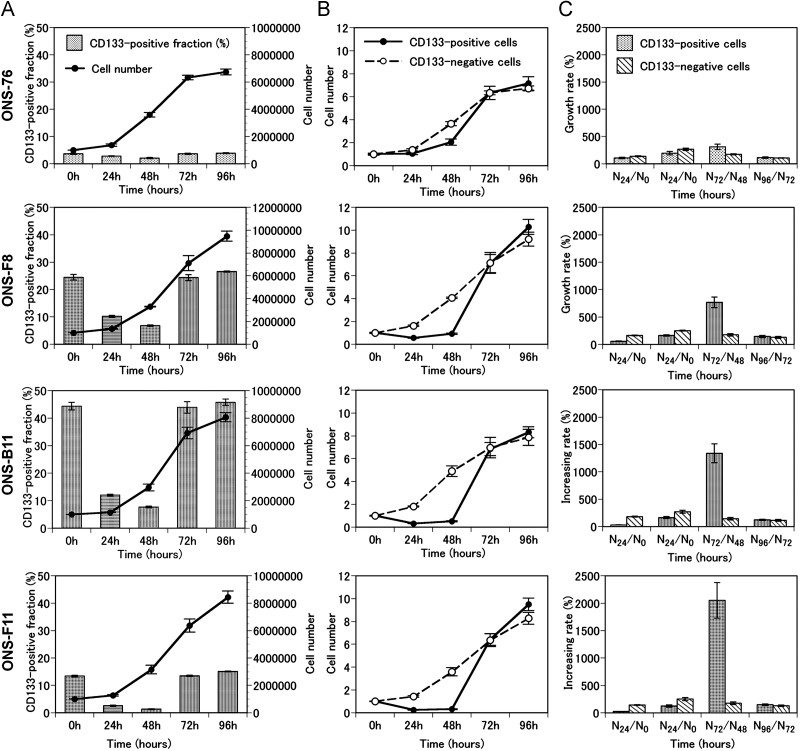
Fig. 5.
Chronological changes of cell counts and CD133-positive fractions of the selected clones and the parental cells.
(A) Cell counts (line graphs) and CD133-positive fractions (bar graphs) of ONS-76, ONS-F8, ONS-B11 and ONS-F11 were plotted against time. (B) Cell counts of CD133-positive cells (solid lines) and CD133-negative cells (dotted lines) of ONS-76, ONS-F8, ONS-B11 and ONS-F11 were plotted against time. Cell counts were normalized to 1 at 0 h. (C) Increase rates (%) of CD133-positive and CD133-negative cells of ONS-76, ONS-F8, ONS-B11 and ONS-F11at the time-points indicated. Error bars indicate standard deviation.

