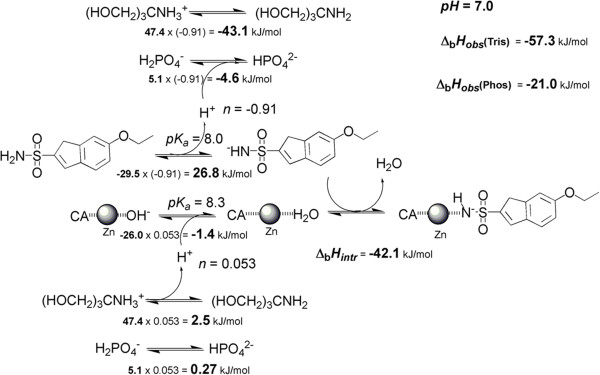
Figure 1.
The processes linked to the binding of EZA to hCA XIII. Two central reactions show the deprotonation of the inhibitor sulfonamide group and protonation of the zinc-bound hydroxide to make water molecule and consecutive binding of the two active species. Two top and bottom lines show linked buffer protonation reactions. The numbers give estimates of intrinsic enthalpies for each process multiplied by the number of linked protons (n) yielding the observed enthalpic contribution of each reaction at pH 7.0. The numbers n were estimated by fitting the enthalpy dependence on pH data. The intrinsic enthalpy of binding is shown next to the reaction and is equal to −42.1 kJ/mol. The observed enthalpies are estimated for both buffers in the right upper corner. These values are similar to experimentally observed values listed in Table 1. Zinc atom is shown as grey shaded sphere and the carbonic anhydrase is shown as CA.

