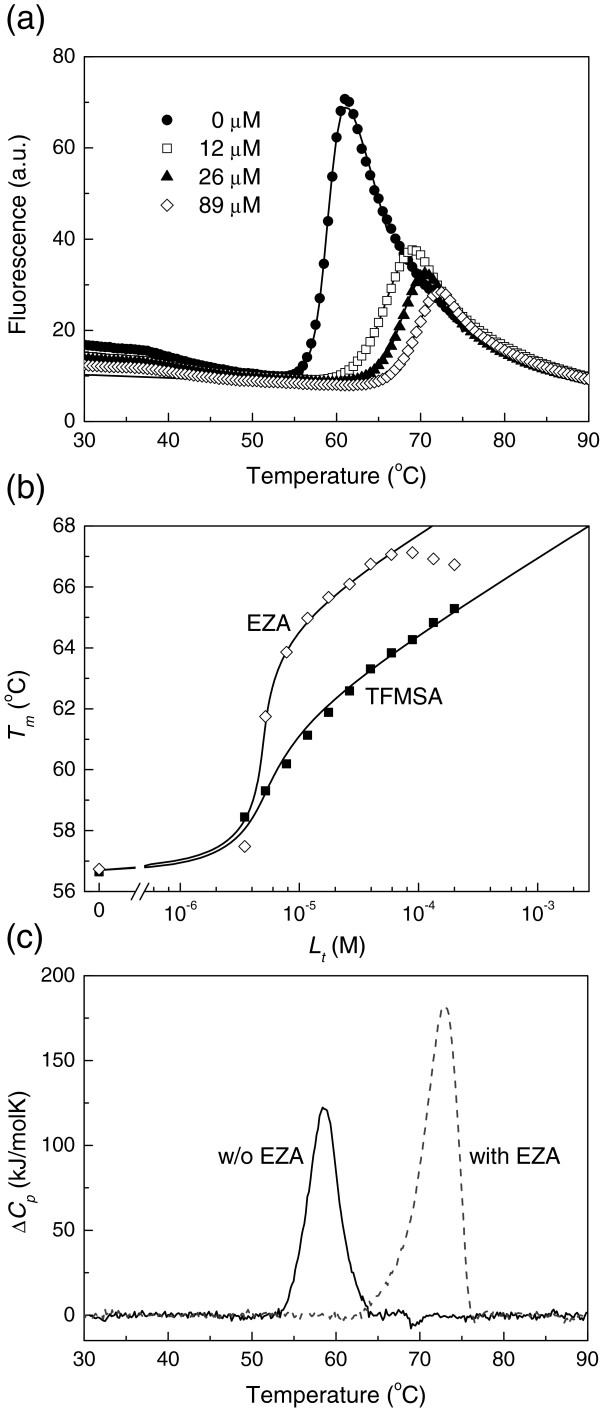
Figure 4.
Thermal shift assay and DSC data of EZA and TFMSA binding to hCA XIII. (a) Thermal melting fluorescence curves of hCA XIII (concentration 10 μM) in sodium phosphate buffer, pH 7.0, in the presence of various EZA concentrations, 0 μM (◆), 12 μM (□), 26 μM (▲), and 89 μM (◊). Ligand addition shifted the protein melting temperatures upwards. (b) The dose response curves as a function of added concentration of EZA (◊) or TFMSA (■). Datapoints are obtained from fluorescence melting curves such as in panel (a), while the lines are fitted according to [27-29]. The addition of EZA shifted the Tms more than TFMSA at the same concentration. Therefore, the observed Kbs are greater for EZA than for TFMSA. The possible reasons for the bending of the EZA data have been previously discussed [29]. (c) DSC curves of hCA XIII (50 μM) in the absence (solid line) and presence of 500 μM EZA (dashed line) in sodium phosphate buffer at pH 7.0. The addition of EZA shifted the peak to higher temperatures (thus stabilized the protein) and the area under the peak (equal to the enthalpy of unfolding) has increased due to positive heat capacity of unfolding.

