Abstract
The ability to visualize myelin is important in the diagnosis of demyelinating disorders and the detection of myelin-containing nerves during surgery. The development of myelin-selective imaging agents requires that a defined target for these agents be identified and that a robust assay against the target be developed to allow for assessment of structure-activity relationships. We describe an immunohistochemical analysis and a fluorescence polarization binding assay using purified myelin basic protein (MBP) that provides quantitative evidence that MBP is the molecular binding partner of previously described myelin-selective fluorescent dyes such as BMB, GE3082, and GE3111.
Keywords: fluorescence polarization, myelin basic protein, nerves, myelin, dye
Myelin is a protein- and lipid-rich dielectric substance that protects and insulates neuronal axons and is essential for the proper functioning of the central nervous system (CNS) and peripheral nervous system (PNS). Myelin loss is a hallmark of neurological diseases such as multiple sclerosis, spinal cord injury, and Alzheimer disease (Minodora and Hans 2005; Chen et al. 2011; Zavodszky et al. 2011). Myelin is also a major component of peripheral nerves. In many lifesaving surgical procedures, inadvertent nerve injury can occur and is often the result of poor visibility of the peripheral nerves compared with the surrounding tissue (Kretschmer et al. 2009). There is a need to develop imaging agents that bind to and stain the myelin sheath in vivo to better understand the pathophysiology of demyelinating diseases and to visualize nerve anatomy during surgery. The ideal in vivo imaging agent should exhibit selectivity to a component of myelin as well as be able to penetrate the blood-brain and blood-nerve barriers. Several such agents have now been reported, including small molecules such as GE3111 and GE3082 for visualizing nerves in real time during surgery (Gibbs-Strauss et al. 2011; Cotero et al. 2012; Gray et al. 2012), as well as BMB and CIC for positron emission tomography imaging (Stankoff et al. 2006; Wang et al. 2009).
Although these molecules were demonstrated to bind to myelin, the varied biological composition of the myelin sheath poses a hindrance to the identification of their precise molecular target. Myelin has a unique composition consisting of a matrix of 80% lipid and 20% protein. The lipid fraction consists of cholesterol, cholesterol ester, cerebroside, sulfatide, sphingomyelin, phosphatidylethanolamine, phosphatidylcholine, phosphatidylserine, phosphatidylinositol, triacylglycerol, and diacylglycerol (Riccio et al. 2000). The protein fraction is composed of several proteins, which include myelin basic protein (MBP), myelin-associated glycoprotein (MAG), and connexin 32, which are produced by both PNS and CNS cells; the protein myelin protein zero (MPZ) and peripheral myelin protein 22 (PMP22), produced by the PNS; and proteolipid protein, produced by the CNS cells only (Kursula 2001). In addition, the Schwann cell proteins, S100 and 2′,3′-cyclic nucleotide-3′-phosphohydrolase (CNPase), are associated with myelin (Mata et al. 1990; Hinman et al. 2008).
There is speculative evidence in the literature that highlights MBP as the binding target of GE3082, BMB, and CIC. These agents are derivatives of Congo red, a dye originally used to stain amyloid deposits in Alzheimer disease by binding amyloid-like protein with five adjacent β-sheet structures (Glenner et al. 1972; Klunk et al. 1989, 2002). Indeed, a β-sheet structure has been described in MBP (Ridsdale et al. 1997). In line with that is the observation that there is less BMB binding in the shiverer mice lacking the MBP gene (Stankoff et al. 2006), although it is difficult to determine whether the loss in binding is linked directly to the MBP loss or to the indirect effects on myelin structure and integrity.
Thus, to the best of our knowledge, there is no direct experimental evidence showing that the small-molecule myelin imaging agents mentioned above bind to MBP. In this article, we describe immunohistochemical analysis and a novel fluorescence polarization (FP) binding assay using purified MBP to demonstrate that MBP is the molecular binding partner of nerve-selective imaging agents such as BMB, GE3082, and GE3111.
Materials and Methods
Synthesis and Characterization of Nerve-Selective Imaging Agents BMB, GE3082, GE3065, GE3138, and GE3111
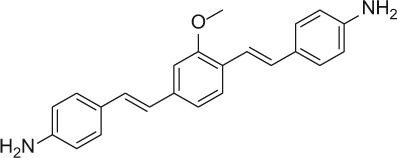
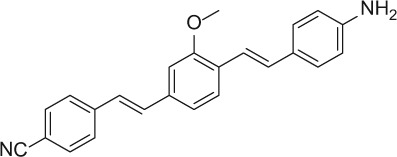
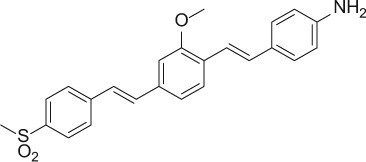
The nerve-highlighting imaging agents BMB (4,4′- [(2-methoxy-1,4-phenylene)di-(1E)-2,1-ethenediyl] bis-benzenamine) and GE3082 (4-[(1E)-2-[4-[(1E)-2-[4-aminophenyl] ethenyl]-3-methoxyphenyl] ethenyl]-benzonitrile) have been described (Gibbs-Strauss et al. 2011). GE3111 (1-methylsulfonyl-4-[(1E)-2-[4-[(1E)-2-[4-aminophenyl] ethenyl]-3-methoxyphenyl] ethenyl]-benzene) and GE3138 (2-(4-(4-((E)-2-(7-(4-aminostyryl)-2,3-dihydrothieno[3,4-b][1,4]dioxin-5-yl)vinyl)phenylsulfonyl)piperazin-1-yl)ethanol) were synthesized via a tandem Heck coupling of Boc-protected 4-aminostyrene with the correspondingly functionalized bromoaryl aldehyde, followed by a Horner-Wittig olefination sequence with functionalized benzylphosphonate (Cotero et al. 2012). Following synthesis, all dyes were purified by preparative high-pressure liquid chromatography (HPLC). GE3082 was purified by normal phase and all other dyes were purified by reverse-phase HPLC. Both reaction progress and dye purity were determined by reverse-phase HPLC using the water/acetonitrile gradient (with 0.1% v/v formic acid each) on a Shimadzu LCMS 2010EV (Shimadzu; Kyoto, Japan), equipped with a Waters XBridge Shield RP18 2.5 micron, 2.1 × 50–mm column (Waters Corp.; Milford, MA), a UV-visible photodiode array (190−800 nm), and electrospray ionization (ESI) mass spectrometer (MS) collecting both ESI+ and ESI– modes. The dyes were verified to be a single peak by absorption at several wavelengths. In addition, proton nuclear magnetic resonance data were collected using a Bruker Avance 400 MHz instrument (Bruker; Billerica, MA). The final purity for all the dyes was >99%. Final purity was checked on an analytical HPLC Shimadzu LC-20AD, equipped with a fluorescence detector. Table 1 shows the structures of these molecules.
Table 1.
Chemical Structures of Myelin-Selective Fluorescent Dyes
| Compound | Structure |
|---|---|
| BMB |
|
| GE3082 |
|
| GE3111 |
|
| GE3138 |

|
Immunohistochemistry
For ex vivo histological evaluation, brain striatum or nerve tissue from male Sprague Dawley rats was fixed by perfusion and postfixed with 10% neutral buffered formalin for 5 min at room temperature. Following postfixation, tissue was cryoprotected in a 20% sucrose solution made in phosphate-buffered saline (PBS). Tissue was then flash-frozen in freezing media (OCT; Fisher Scientific, Waltham, MA) using methanol and dry ice. Polyvinylidene fluoride membranes were used to help keep the tissue elongated in the OCT. Thin sections (5–10 microns) were sliced on a Leica microtome (Leica; Wetzlar, Germany) and stored in a −80C freezer prior to staining. Serial sections of the brain striatum were stained for a panel of myelin proteins such as CNPase, MAG, PMP22, S100, MBP, and MPZ. The primary antibody vendor, catalog number, and dilutions are listed in Table 2. Antigen retrieval was done by incubating the tissue with a Tris/Borate/EDTA buffer, pH 8 (CC1 antigen retrieval solution from Ventana Medical Systems, Oro Valley, AZ), for 30 min at 95C. The tissue was blocked in 10% donkey/goat serum in PBS depending on the host of the secondary antibody. Primary antibody diluted in 10% donkey/goat serum in PBS was applied and the slides were incubated at 37C for 1 hr. Cy3- or Cy5-conjugated secondary antibodies were purchased from Jackson ImmunoResearch Laboratories (West Grove, PA) and used at a dilution of 1:200 in 10% donkey/goat serum in PBS. Secondary antibody was applied, after which the slides were incubated at 37C for 1 hr. Rinsing steps were applied automatically between each of these steps. After coverslipping, protein expression was determined by imaging the slides on a Zeiss Axioimager microscope (Carl Zeiss; Jena, Germany) at 200× magnification, using the appropriate filter set.
Table 2.
Sources of Primary Antibodies and Dilutions
| Antibody | Vendors and Catalog Numbers | Dilution |
|---|---|---|
| MBP | Abcama ab2404 | 1:50 |
| MPZ | Abcam ab39375 | 1:100 |
| CNPase | Lab Vision/Thermob MS-349 | 1:50 |
| MAG | Millipore/Chemiconc MAB1567 | 5–10 µg/mL |
| S100A1 | Lab Vision/Thermo MS-296 | 1:100 |
| PMP22 | Lab Vision/Thermo MS-1293 | 2–4 µg/mL |
Cambridge, MA, USA
Kalamazoo, MI, USA
Billerica, MA, USA
Ex Vivo Staining of BMB in Brain Striatum
Tissue sections were prepared as mentioned above. The slides were rinsed in PBS (3 × 5 min). BMB (with a final concentration of 10 µM) was added onto the tissue in a buffer containing 10% Cremophor EL and 60% rat serum in PBS. The slides were incubated for 1 hr in a dark, humid chamber, after which they were washed with PBS (3 × 5 min), coverslipped, and imaged using a custom filter cube (excitation filter: 387 nm with 11-nm band pass, 409-nm dichroic mirror; emission filter: 409 nm long pass). A buffer-only control (no BMB) was also performed using the same procedure to determine autofluorescence under the same settings.
Specificity of the MBP Antibody
Tissue sections were prepared as mentioned above. MBP antibody (ab2404 from Abcam, Cambridge, UK) was tested at a dilution of 1:50 or 1:500. Cy3 secondary antibody (711-166-152 from Jackson ImmunoResearch Laboratories) was applied at a dilution of 1:200 in 10% donkey serum in PBS, after which the slides were incubated at 37C for 1 hr. Rinsing steps were applied automatically between each of these steps. The specificity of the antibody was checked by preabsorption of the antibody with purified MBP protein (ALX-200-606-M001 from Enzo Life Sciences, Farmingdale, NY) by incubating in 1:10 ratio (MBP protein in excess) overnight at 4C before staining the striatum. The tissue sections were stained and imaged as described above.
Ex Vivo Co-staining of BMB or GE3082 and MBP
Co-staining of BMB or GE3082 and MBP was performed in the trigeminal nerves and brain striatum as described above with a few modifications. BMB or GE3082 was added at 10 µM along with the MBP primary antibody (1:50 dilution) and incubated at 37C for 1 hr. Cy3 secondary antibody was applied as described above. Rinsing steps were applied between each of these steps. After coverslipping, staining was determined by imaging the slides on a Zeiss Axioimager microscope at 200× magnification, using the Cy3 filter set for MBP. BMB or GE3082 was imaged using a custom filter cube (excitation filter: 387 nm with 11-nm band pass, 409-nm dichroic mirror; emission filter: 409 nm long pass).
In Situ Nerve Imaging and Microscopic Evaluation of Nerves following In Vivo Administration of BMB and GE3082
In vivo nerve imaging studies on BMB and GE3082 were described previously (Gibbs-Strauss et al. 2011). Briefly, a dose of 14 mg/kg each of BMB and GE3082 was administered intravenously into mice. Four hours postinjection, the nerves were exposed and in situ fluorescence nerve imaging was performed using the Zeiss-Lumar V.12 surgical microscope. A filter centered at 406 nm with a 15-nm bandwidth was used for excitation of both BMB and GE3082. An emission filter set at 525/30 nm and 625/26 nm was used for BMB and GE3082, respectively. Following in situ imaging, the trigeminal nerves were collected, frozen in OCT media, and sliced at a 10-micron thickness on a cryotome. Nerve tissue slides were then stained for MBP expression and imaged using the protocol described above. For data analysis, raw tagged image format images were used in all cases. Within each image representing the BMB or GE3082 channel, 10 circular regions of interest (ROIs) were drawn representing nerve-containing tissues, adjacent tissues, and regions without tissues. All ROIs were identical in size (2190 pixels). All regions of the image were represented. The identical, co-localized ROIs were drawn in the MBP channel. The average channel signal intensities from each ROI were plotted against each other. The MBP channel was plotted on the x-axis and the BMB/GE3082 channel was plotted on the y-axis. The data points were fitted into a linear regression model.
Preparation of Native MBP
MBP in its native lipid-bound form was purified from bovine brain according to published protocols (Riccio et al. 1984, 1990, 1994) and was provided by Prof. Paolo Riccio from the University of Bari, Italy. The native MBP was obtained with a purity of 95% as determined by densitometry analysis of SDS-PAGE (Suppl. Fig. S1).
To extract the lipid from MBP, the Bligh-Dyer extraction method (Bligh and Dyer 1959) was used with a few modifications. To the 200-µL MBP sample, 750 µL of chloroform: methanol (1:2, v:v) was added and the sample vortexed. An additional 250 µL of chloroform was added and the sample was vortexed. Next, 250 µL of distilled water was added and the sample was vortexed again followed by a 5-min centrifugation spin at 1000 × g. The bottom lipid fraction was collected and dried under nitrogen before being reconstituted into a buffer containing 0.25% CHAPS in 20 mM Tris (pH 7.5).
Fluorescence Polarization Assay
FP binding assays were performed by mixing increasing amounts of native MBP with a fixed concentration of the fluorophores in 96-well black polystyrene plates (Costar; Corning, Corning, NY). Protein and fluorescent ligand dilutions were made in 0.25% CHAPS in 20 mM Tris (pH 7.5), which also served as the binding buffer. The reagents were allowed to incubate at room temperature for 10 min, after which raw S (fluorescence intensity in the parallel direction) and P (fluorescence intensity in the perpendicular direction) values were measured at λmax for maximal excitation and emission for various ligands and their binding counterparts (Table 3) using the fluorescence polarization mode of Spectra Max M5 (Molecular Devices; Sunnyvale, CA). The corresponding excitation and emission spectra are shown in Supplementary Figures S2 and S3. The raw S and P values were used to calculate Yobs (observed anisotropy) using the equation = [(S – P)/(S + 2P)] × 1000.
Table 3.
Excitation and Emission Maximaa of Myelin-Selective Fluorescent Dyes under the Conditions of the Fluorescence Polarization Assay
| Compound and Condition | λmax (Excitation) nm | λmax (Emission) nm |
|---|---|---|
| GE3082 with native MBP | 400 | 600 |
| GE3082 with extracted lipid | 410 | 570 |
| GE3082 with olive oil | 400 | 540 |
| GE3111 with native MBP | 400 | 540 |
| GE3111 with extracted lipid | 400 | 540 |
| GE3111 with olive oil | 400 | 540 |
| BMB with native MBP | 390 | 480 |
| GE3138 with native MBP | 450 | 590 |
MBP, myelin basic protein.
The excitation and emission spectrum for each compound and condition can be found in Supplementary Figures S2 and S3.
Calculation of the Kd, Ybound, and Yfree values was performed using the following equation (Swillens 1995, see also Chapter 8 of Invitrogen’s FP Resource Guide [Invitrogen, Carlsbad, CA]).
where
Yfree = anisotropy of the free fluorophore
Ybound = anisotropy of the bound fluorophore
Kd = dissociation constant
Ct = MBP concentration used in the assay
F = concentration of the fluorophore used in the assay
Yobs (observed anisotropy) was calculated at each Ct (MBP concentration) using the raw S and P values, and F (concentration of fluorophore) is known. The equation is solved by non-linear regression using SigmaPlot version 11.2 (Systat Software; San Jose, CA) to obtain the Kd, Ybound, and Yfree values.
Results
Correlation between MBP Expression and Staining with Myelin-Selective Imaging Agents
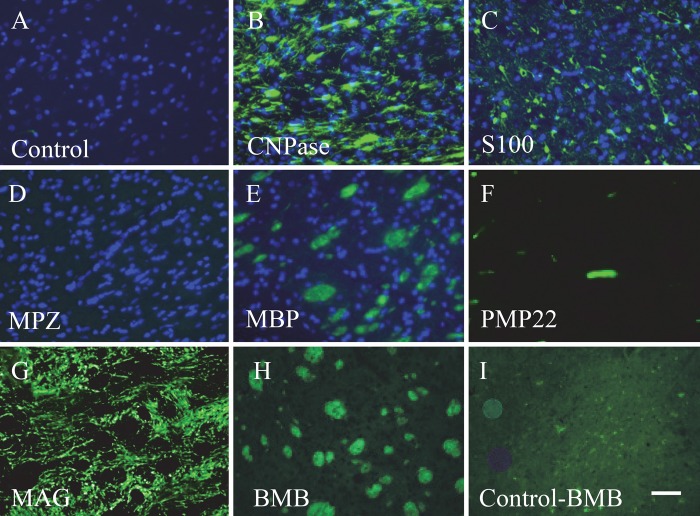
Expression of constituent myelin proteins was compared in the brain striatum. MBP (Fig. 1E) was present in the brain striatum along with CNPase (Fig. 1B), S100 (Fig. 1C), and MAG (Fig. 1G). As expected, we saw no staining for MPZ, a protein known to be expressed only in the PNS (Fig. 1D). BMB staining of the striatum is shown in Figure 1H. An unstained section of striatum showed low autofluorescence when imaged under the same imaging condition as BMB-stained striatum (Fig. 1I). BMB staining in the brain striatum closely resembled the morphology of the MBP expression pattern (Fig. 1H and 1E, respectively).
Figure 1.
Expression of constituent myelin proteins and BMB staining in serial sections of brain striatum. The control, containing the secondary antibody only (no primary antibody), is shown in A. Staining with an antibody against CNPase (B), S100 (C), MPZ (D), MBP (E), PMP22 (F), and MAG (G) is shown. BMB staining is shown in (H) along with its control (I), a tissue section with no BMB imaged under the same conditions as with BMB. Nuclear staining by DAPI is also shown in panels A to E. Bar = 50 µm.
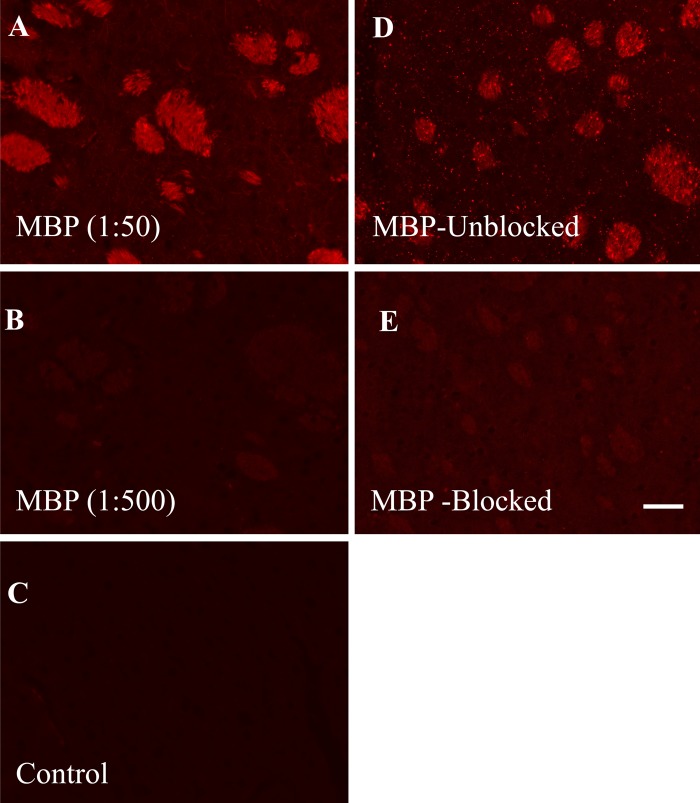
To demonstrate the specificity of the MBP antibody staining, we first determined that its dilution (1:50) was optimal. Lowering the dilution to 1:500 produced no significant staining of the brain striatum (Fig. 2A, B). Because the MBP antibody was raised against the full MBP protein, an absorption control study was performed by incubating the antibody with the full MBP protein prior to staining the tissue section. The MBP antibody with the blocking protein did not significantly stain the brain striatum (Fig. 2E).
Figure 2.
Specificity of the myelin basic protein (MBP) antibody in staining the brain striatum. The antibody was used at a dilution of 1:50 (A) and 1:500 (B). The control containing the secondary antibody alone (no MBP antibody) is shown in C. Using the optimal 1:50 dilution, the MBP antibody was preabsorbed with the MBP protein prior to staining. Panel D shows the MBP staining without the blocking protein, while panel E shows the effect of blocking by the protein. Bar = 50 µm.
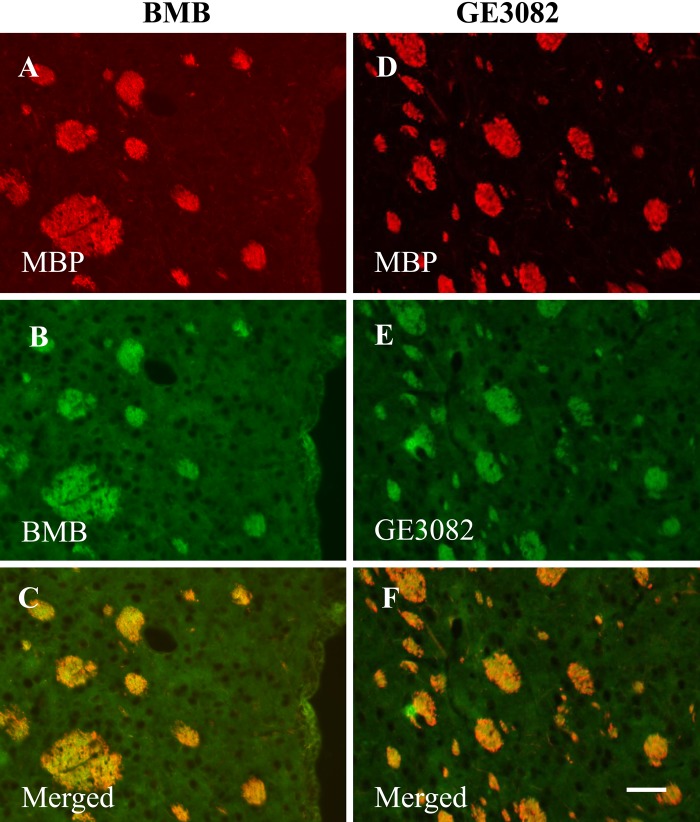
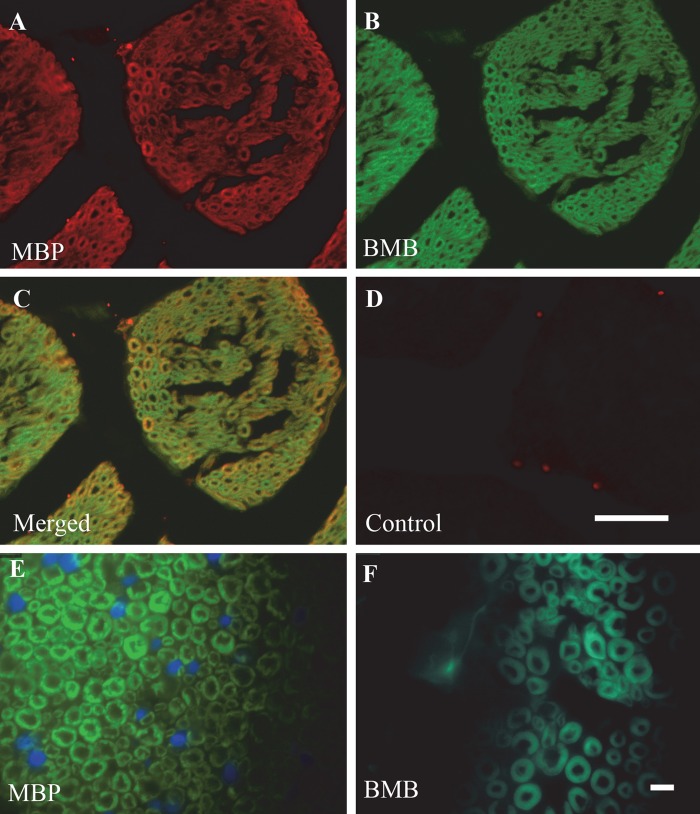
To confirm whether the staining pattern of BMB or GE3082 correlated with the expression pattern of MBP in the same tissue section, co-staining of BMB or GE3082 and the antibody against MBP was performed on tissue sections of brain striatum (Fig. 3) and trigeminal nerve (Fig. 4). Figure 3C, F shows the co-localization of MBP staining with BMB and GE3082, respectively. In addition, the trigeminal nerves displayed the characteristic donut-shaped myelinated nerve fibers with MBP and BMB staining when visualized under a 1000× magnification (Fig. 4E, F).
Figure 3.
Ex vivo co-staining of myelin basic protein (MBP) expression with BMB (left panel, A–C) or GE3082 (right panel, D–F) in brain striatum. Co-localization of MBP with BMB is shown in panel C, whereas co-localization of MBP with GE3082 is shown in panel F. Bar = 50 µm.
Figure 4.
Ex vivo co-staining of myelin basic protein (MBP) expression (A) with BMB (B) in trigeminal nerve sections. Co-localization of both MBP and BMB is shown in panel C. The control containing the secondary antibody alone (no MBP antibody) is in panel D. Higher magnification images of serial sections of trigeminal nerve comparing MBP staining (E) with BMB staining (F). Bars: A–D = 50 µm; E–F = 10 µm.
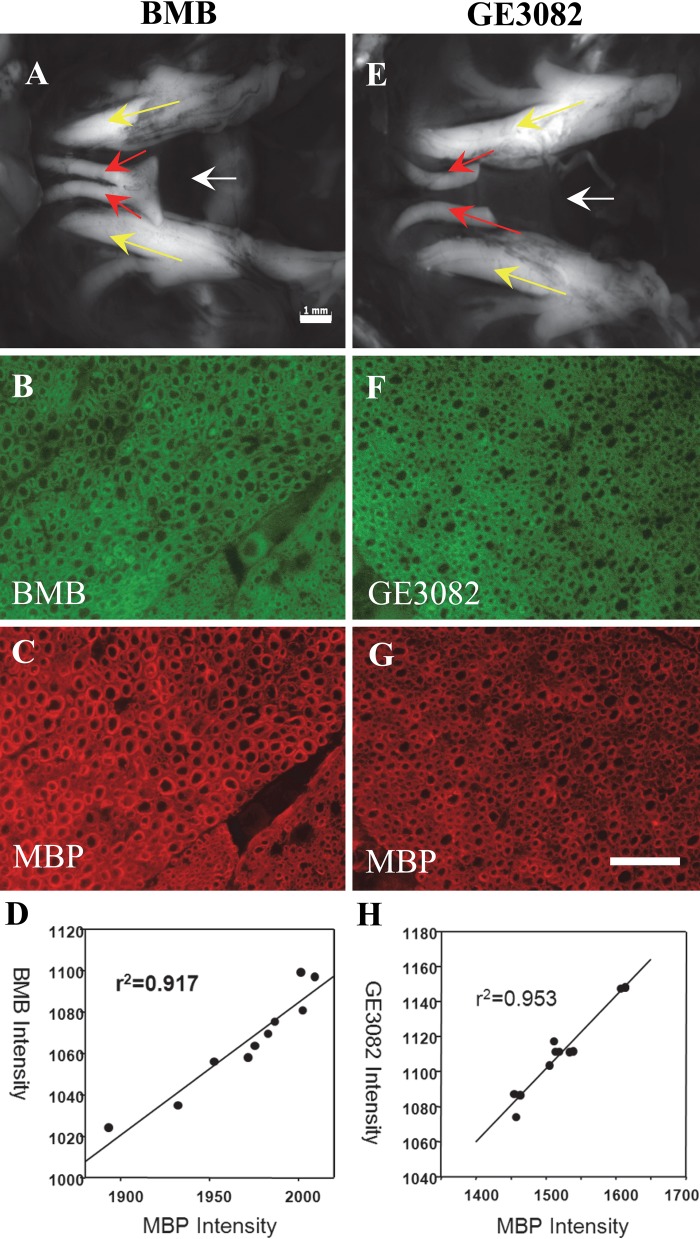
Finally, BMB and GE3082 were each injected intravenously into mice. Following sufficient time for clearance and biodistribution, fluorescence imaging of the nerves was performed. The nerves were then resected and stained with the antibody against MBP, and the staining pattern of the fluorophores was correlated with MBP expression. Figure 5A, E shows the in vivo fluorescence images of the trigeminal nerves of mice treated with BMB and GE3082, respectively. Fluorescence microscopy images of the resected nerves stained with MBP showed that MBP and the in vivo administered fluorophores were co-localized (BMB and MBP shown in Fig. 5B, C; GE3082 and MBP shown in Fig. 5F, G) with correlation coefficient between the in vivo fluorophore staining and the MBP staining above 0.9 for both BMB and GE3082 (Fig. 5D and 5H, respectively).
Figure 5.
BMB and GE3082 were injected intravenously in mice and the nerves were imaged. In vivo fluorescence images of the trigeminal nerves of mice treated with BMB (A) and GE3082 (E). Yellow arrow = trigeminal nerves; red arrow = optic nerves; white arrow = sphenoid bone lying under the nerves. The nerves were resected and co-stained with the myelin basic protein (MBP) antibody. BMB and GE3082 staining in the sectioned trigeminal nerve is shown in panels B and F, respectively. MBP staining of BMB- and GE3082-stained sections is shown in panels C and G, respectively. Correlation between MBP and BMB staining is shown in panel D, whereas that of MBP and GE3082 is shown in panel H. Bars: A, E = 1 mm; B–G = 50 µm.
Development of an FP-Based Binding Assay
Fluorescence microscopy studies suggested that MBP is the binding target of the imaging agents, BMB and GE3082. We next sought to develop a binding assay that would provide quantitative binding affinity between these fluorophores and MBP.
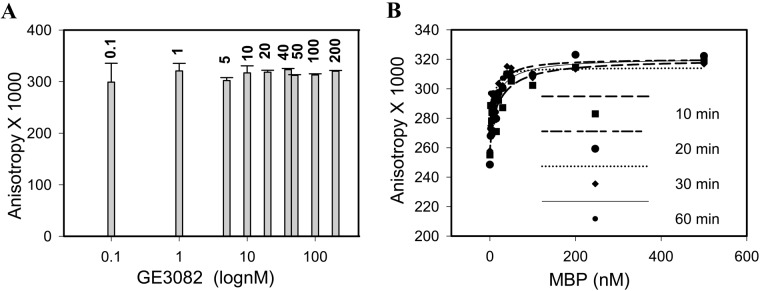
To choose an optimum ligand concentration, the FP signal at varying GE3082 concentrations was measured in the presence of 1 µM purified native MBP. The FP signal did not change significantly with increasing GE3082 concentrations (Fig. 6A). To avoid dilution errors associated with low ligand concentrations, 100 nM was chosen as the optimum concentration. Having fixed the ligand concentration, the stability of the FP signal at 100 nM GE3082 was determined at different time points. There was no significant change in the FP signal when measured at 10, 20, 30, and 60 min postincubation (Fig. 6B). For practical purposes, 10 min was chosen as the incubation time for subsequent studies.
Figure 6.
Stability of the fluorescence polarization signal at different GE3082 concentrations when incubated with 1 µM purified native myelin basic protein (MBP) (A) and at different time points and concentrations of purified native MBP (B).
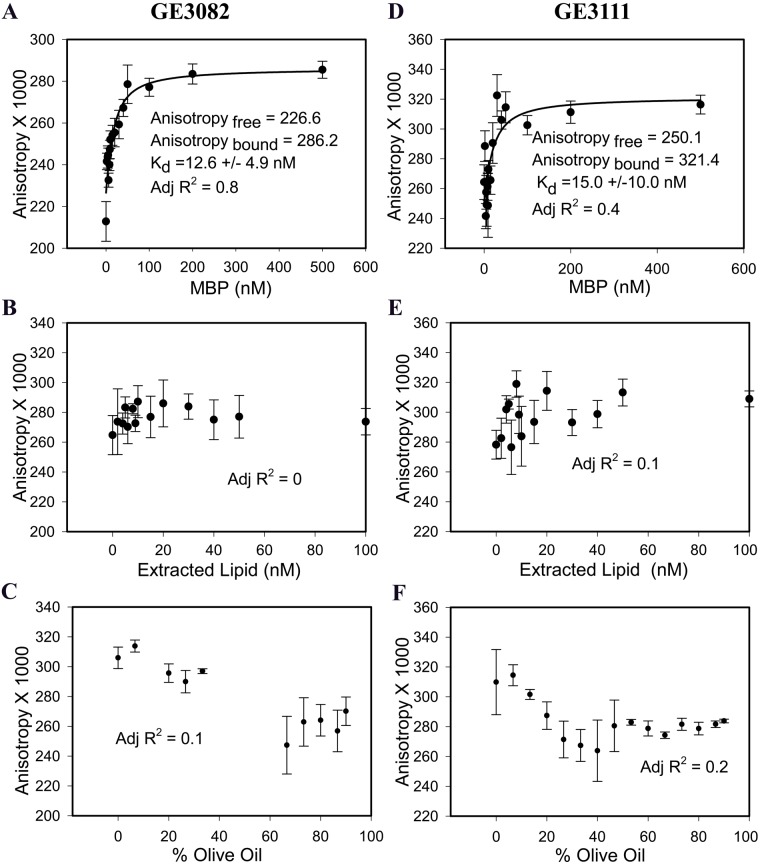
After the experimental conditions were established, the affinity of GE3082 for MBP was determined to be 12.6 nM (Fig. 7A). To rule out the possibility that GE3082 was binding to the lipid associated with the MBP complex, the lipids were extracted using Bligh-Dyer extraction method (Bligh and Dyer 1959). The lipids that were extracted by organic solvents when reconstituted in aqueous solution formed multilamellar vesicles (Riccio et al. 2000).
Figure 7.
Fluorescence polarization (FP) assay on GE3082 binding to purified native (unextracted) myelin basic protein (MBP) (A), extracted lipid (B), and olive oil (C). FP assay on GE3111 binding to native (unextracted) MBP (D), extracted lipid (E), and olive oil (F). Data are represented as mean ± SEM (n≥3).
GE3082 binding to the native, unextracted MBP resulted in a good fit (adjusted R2 = 0.8) to a single-site saturation binding equation, whereas binding to extracted lipid resulted in a poor fit (adjusted R2 = 0) to the same equation (Fig. 7B). This suggested that GE3082 displayed specific saturation binding to the native MBP complex and not to the extracted lipid alone.
Because of the lipophilic nature of BMB and GE3082, these agents were previously reported to partition nonspecifically to adipose tissue (Gibbs-Strauss et al. 2011). The majority of fatty acid content of adipose tissue is composed of oleic, palmitic, and linoleic acids (Kokatnur et al. 1979), similar to olive oil. To determine whether the FP assay can distinguish between specific and nonspecific binding, GE3082 association with olive oil was measured. There was no change in the anisotropy of GE3082 in the presence of increasing amounts of olive oil (Fig. 7C).
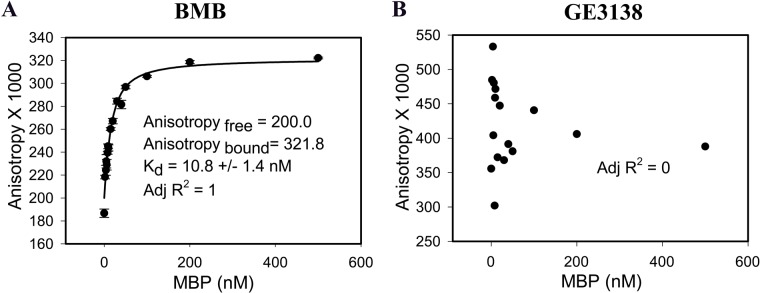
The affinity of GE3111 to MBP was measured. GE3111 is a more water-soluble analogue of GE3082 and showed selective binding to myelin-rich tissue ex vivo and in vivo (Cotero et al. 2012). GE3111 bound to native MBP with a Kd of 15 nM (adjusted R2 = 0.4) and demonstrated no measurable binding to extracted lipid (adjusted R2 = 0.1) or to olive oil (Fig. 7D–F). Finally, the affinity of BMB was also determined (Fig. 8A). BMB bound to native MBP with a Kd of 10.8 nM (adjusted R2 = 1). As a negative control, we tested GE3138, a derivative that did not stain nerves (Suppl. Fig. S4). As expected, GE3138 did not exhibit specific and saturable binding to native MBP in the FP assay (adjusted R2 = 0) (Fig. 8B).
Figure 8.
Fluorescence polarization assay on BMB (A) and GE3138 (B) binding to purified native myelin basic protein (MBP). Data for BMB are represented as mean ± SEM (n≥3).
Discussion
In vivo myelin-labeling methodologies are useful in diagnosing myelin-associated neuropathies as well as in intraoperative visualization of myelin-rich nerves to avoid accidental nerve injury. BMB, GE3082, and GE3111 had been successfully used for in vivo imaging of myelin-rich tissue. Immunohistochemistry studies suggested that MBP is the primary binding partner of these agents. We then sought to develop a quantitative binding assay not only to demonstrate the specificity of these agents but also to enable structure-activity relationship studies for development of analogues with improved properties.
Our initial efforts in developing a radioactivity-based assay using a radiolabeled analogue of BMB were unsuccessful due to spontaneous radiolysis of the tritium-labeled BMB. We next focused our efforts on developing a fluorescence-based binding assay that would leverage the intrinsic fluorescent nature of these compounds. FP binding assays measure the rotational diffusion of a small fluorescent ligand in the absence and presence of a larger unlabeled binding partner. When excited with plane polarized light, a freely tumbling fluorescent ligand in solution will emit light in all different directions relative to the excited light, resulting in a low polarization or anisotropy. Binding of the ligand to a larger binding partner will restrict its rotation, and the emitted light will be largely in the plane of the excited light, resulting in high polarization or anisotropy. The observed anisotropy is a measure of the fraction of ligand bound to its binding partner and can be used to measure the affinity of interaction between the two (Checovich et al. 1995). FP assays have several advantages over conventional radioligand binding assays. Polarization assays are homogeneous, reproducible, and easily automated, and they require lower amounts of ligand and protein. As they use a fixed, low concentration of a fluorescent ligand in the presence of increasing unlabeled protein concentrations, they are less sensitive to contributions of nonspecific binding. Because polarization is an intrinsic property of fluorescent molecules, these assays are less susceptible to changes in absolute fluorescence intensity due to environmental fluctuations (Jameson and Ross 2010).
MBP in its lipid-bound native form was used in the binding studies to preserve its native conformation. Indeed, circular dichroism studies showed that when prepared in a water-soluble form, MBP has a more disordered structure compared with its native conformation (Polverini et al. 1999).
The FP assay determined that the Kd of BMB and its analogues, GE3082 and GE3111, toward purified native MBP ranged from 10 to 15 nM. These values are slightly higher but in agreement with the previously published value of 1 nM for tritiated BMB (Wang et al. 2009). This difference could be attributed to the fact that previous studies used a crude myelin extract, whereas the present study was conducted using isolated MBP. The FP assay was able to distinguish between specific binding interactions (consistent increase in anisotropy that ultimately reaches saturation) and a combination of incomplete and nonspecific binding events (inconsistent small increase in anisotropy that does not saturate and or no increase in anisotropy).
Fluorescence imaging of myelin could provide a valuable tool for image-guided surgery by allowing real-time visualization of myelin-containing nerves. For clinical translation, better differentiation of nerve from adipose tissue fluorescence may be necessary. One way to address this is to develop derivatives with improved water solubility and reduced lipophilicity. The FP assay will be used to perform structure-activity relationship studies to develop these new derivatives with optimized properties while retaining or improving MBP binding affinity.
Supplementary Material
Acknowledgments
We thank Tricia Tanner, Denise Holmann-Hewgley for technical assistance, Reginald Smith, and Philip Rye for useful discussions.
Footnotes
Declaration of Conflicting Interests: The authors declared a potential conflict of interest (e.g. a financial relationship with the commercial organizations or products discussed in this article) as follows: AB, NEL, VEC, TS, and CATH are employees of General Electric Company. KMF and RMB declared no potential conflicts of interest.
Funding: The authors disclosed receipt of the following financial support for the research, authorship, and/or publication of this article: This work is supported by NIH grant R01EB022872.
References
- Bligh EG, Dyer WJ. 1959. A rapid method of total lipid extraction and purification. Can J Biochem Physiol. 37:911–917 [DOI] [PubMed] [Google Scholar]
- Checovich WJ, Bolger RE, Burke T. 1995. Fluorescence polarization—a new tool for cell and molecular biology. Nature. 375:254–256 [DOI] [PubMed] [Google Scholar]
- Chen H, Epelbaum S, Delatour B. 2011. Fiber tracts anomalies in APPxPS1 transgenic mice modeling Alzheimer’s disease. J Aging Res. 2011:281274. [DOI] [PMC free article] [PubMed] [Google Scholar]
- Cotero V, Siclovan T, Zhang R, Carter R, Bajaj A, LaPlante N, Kim E, Gray D, Staudinger V, Yazdanfar S, et al. 2012. Intraoperative fluorescence imaging of peripheral and central nerves through a myelin-selective contrast agent. Mol Imaging Biol. 14:708–717 [DOI] [PMC free article] [PubMed] [Google Scholar]
- Gibbs-Strauss S, Nasr K, Fish K, Khullar O, Ashitate Y, Siclovan T, Johnson B, Barnhardt N, Tan Hehir C, Frangioni J. 2011. Nerve-highlighting fluorescent contrast agents for image-guided surgery. Mol Imaging. 10:91–101 [PMC free article] [PubMed] [Google Scholar]
- Glenner GG, Eanes ED, Page DL. 1972. The relation of the properties of Congo red–stained amyloid fibrils to the -conformation. J Histochem Cytochem. 20:821–826 [DOI] [PubMed] [Google Scholar]
- Gray D, Kim J, Cotero V, Bajaj A, Staudinger V, Tan Hehir C, Yazdanfar S. 2012. Dual-mode laparoscopic fluorescence image-guided surgery using a single camera. Biomed Optics Express. 3:1880–1890 [DOI] [PMC free article] [PubMed] [Google Scholar]
- Hinman JD, Chen C-D, Oh S-Y, Hollander W, Abraham CR. 2008. Age-dependent accumulation of ubiquitinated 2′,3′-cyclic nucleotide 3′-phosphodiesterase in myelin lipid rafts. Glia. 56:118–133 [DOI] [PubMed] [Google Scholar]
- Jameson DM, Ross JA. 2010. Fluorescence polarization/anisotropy in diagnostics and imaging. Chem Rev. 110:2685–2708 [DOI] [PMC free article] [PubMed] [Google Scholar]
- Klunk WE, Bacskai BJ, Mathis CA, Kajdasz ST, McLellan ME, Frosch MP, Debnath ML, Holt DP, Wang Y, Hyman BT. 2002. Imaging Abeta plaques in living transgenic mice with multiphoton microscopy and methoxy-X04, a systemically administered Congo red derivative. J Neuropathol Exp Neurol. 61:797–805 [DOI] [PubMed] [Google Scholar]
- Klunk WE, Pettegrew JW, Abraham DJ. 1989. Quantitative evaluation of Congo red binding to amyloid-like proteins with a beta-pleated sheet conformation. J Histochem Cytochem. 37:1273–1281 [DOI] [PubMed] [Google Scholar]
- Kokatnur MG, Oalmann MC, Johnson WD, Malcom GT, Strong JP. 1979. Fatty acid composition of human adipose tissue from two anatomical sites in a biracial community. Am J Clin Nutr. 32:2198–2205 [DOI] [PubMed] [Google Scholar]
- Kretschmer T, Heinen CW, Antoniadis G, Richter H-P, Konig RW. 2009. Iatrogenic nerve injuries. Neurosurg Clin North Am. 20:73–90 [DOI] [PubMed] [Google Scholar]
- Kursula P. 2001. The current status of structural studies on proteins of the myelin sheath [review]. Int J Mol Med. 8:475–479 [PubMed] [Google Scholar]
- Mata M, Alessi D, Fink DJ. 1990. S100 is preferentially distributed in myelin-forming Schwann cells. J Neurocytol. 19:432–442 [DOI] [PubMed] [Google Scholar]
- Minodora OT, Hans SK. 2005. Spinal cord injury is accompanied by chronic progressive demyelination. J Comp Neurol. 486:373–383 [DOI] [PubMed] [Google Scholar]
- Polverini E, Fasano A, Zito F, Riccio P, Cavatorta P. 1999. Conformation of bovine myelin basic protein purified with bound lipids. Eur Biophys J. 28:351–355 [DOI] [PubMed] [Google Scholar]
- Riccio P, Bobba A, Romito E, Minetola M, Quagliariello E. 1994. A new detergent to purify CNS myelin basic protein isoforms in lipid-bound form. Neuroreport. 5:689–692 [DOI] [PubMed] [Google Scholar]
- Riccio P, Fasano A, Borenshtein N, Bleve-Zacheo T, Kirschner DA. 2000. Multilamellar packing of myelin modeled by lipid-bound MBP. J Neurosci Res. 59:513–521 [DOI] [PubMed] [Google Scholar]
- Riccio P, Liuzzi GM, Quagliariello E. 1990. Lipid-bound, native-like, myelin basic protein: batch-wise preparation and perspectives for use in demyelinating diseases. Mol Chem Neuropathol. 13:185–194 [DOI] [PubMed] [Google Scholar]
- Riccio P, Rosenbusch JP, Quagliariello E. 1984. A new procedure for the isolation of the brain myelin basic protein in a lipid-bound form. FEBS Lett. 177:236–240 [DOI] [PubMed] [Google Scholar]
- Ridsdale RA, Beniac DR, Tompkins TA, Moscarello MA, Harauz G. 1997. Three-dimensional structure of myelin basic protein, II: molecular modeling and considerations of predicted structures in multiple sclerosis. J Biol Chem. 272:4269–4275 [DOI] [PubMed] [Google Scholar]
- Stankoff B, Wang Y, Bottlaender M, Aigrot M-S, Dolle F, Wu C, Feinstein D, Huang G-F, Semah F, Mathis CA, et al. 2006. Imaging of CNS myelin by positron-emission tomography. Proc Natl Acad Sci U S A. 103:9304–9309 [DOI] [PMC free article] [PubMed] [Google Scholar]
- Swillens S. 1995. Interpretation of binding curves obtained with high receptor concentrations: practical aid for computer analysis. Mol Pharmacol. 47:1197–1203 [PubMed] [Google Scholar]
- Wang Y, Wu C, Caprariello AV, Somoza E, Zhu W, Wang C, Miller RH. 2009. In vivo quantification of myelin changes in the vertebrate nervous system. J Neurosci. 29:14663–14669 [DOI] [PMC free article] [PubMed] [Google Scholar]
- Zavodszky M, Tan Hehir C, Graf J. 2011. Feasibility of imaging myelin lesions in multiple sclerosis. Int J Biomed Imaging. 2011:953806. [DOI] [PMC free article] [PubMed] [Google Scholar]
Associated Data
This section collects any data citations, data availability statements, or supplementary materials included in this article.


