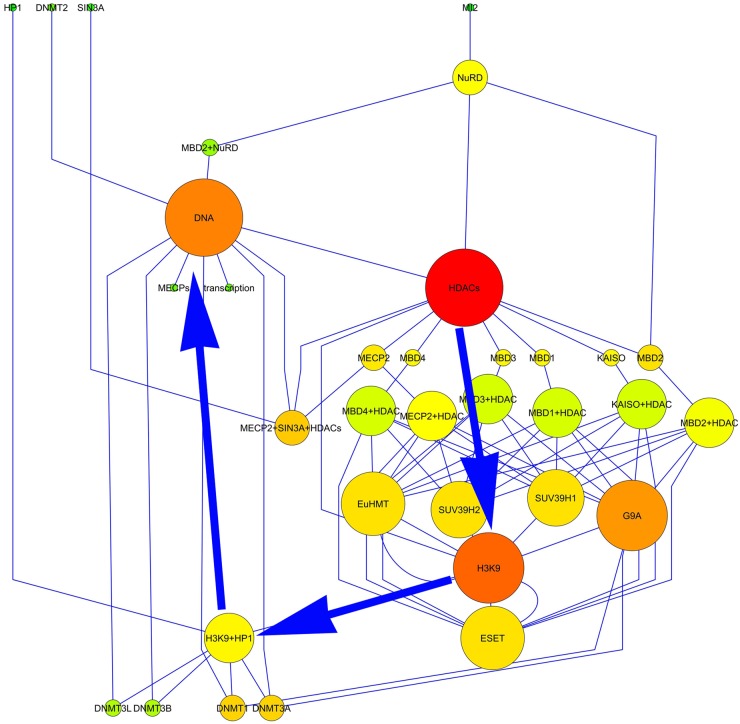
Figure 6.
Sheep oocyte transcriptional silencing (TS) network. The node diameter is proportional to the number of links, and the color varies depending on the closeness centrality (red = 1; green = 0). The spatial network arrangement was obtained by using the yFile Hierarchical Layout. The arrows indicate the flux of the epigenetic events.

