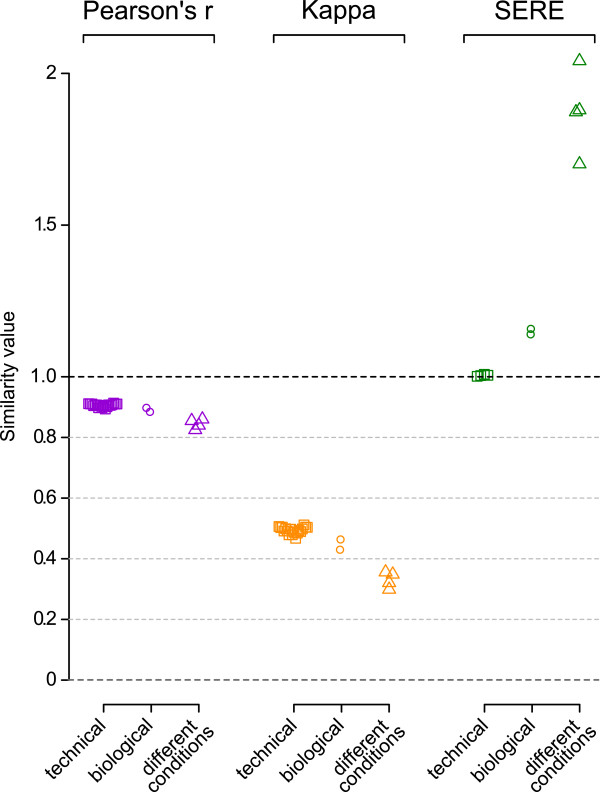
Figure 4.
Benchmarking of the test statistics on empirical RNA-Seq data. Three scenarios were investigated: technical replicates (different lanes from the same RNA-Seq library); biological replicates (different RNA-Seq libraries but same experimental condition); experimental differences (RNA-Seq libraries from different experimental conditions). Pearson’s r and Kappa diverged for the three scenarios but differences were small compared to the impact of varying total read numbers (see Figures 2 and 3). SERE allowed for a straightforward categorization of the three scenarios: technical replicates representing normal/near-normal dispersion were 1; biological replicates representing moderate overdispersion and different experimental conditions representing marked overdispersion ranged from 1.14 to 1.16 and 1.7 to 2.0 respectively, i.e. >>1. For r and Kappa lanes were compared pairwise, whereas for SERE multiple lanes were compared simultaneously. For the biological replicates comparisons and the different experimental conditions, we selected the first lane of each sample as an example to evaluate r and Kappa. For SERE all lanes were included.

