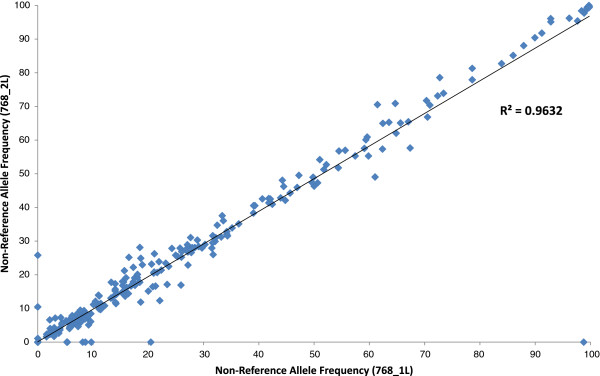
Figure 3.
Reproducibility of target enrichment: Library 768_1L vs. Library 768_2L. Figure 3 shows the comparison of non-reference allele frequency within the two technical replicates (768_1L and 768_2L). R2 represents the square of the Pearson coefficient and reveals high consistency (R2 = 0.9632), and hence reproducibility, between the two replicates.

