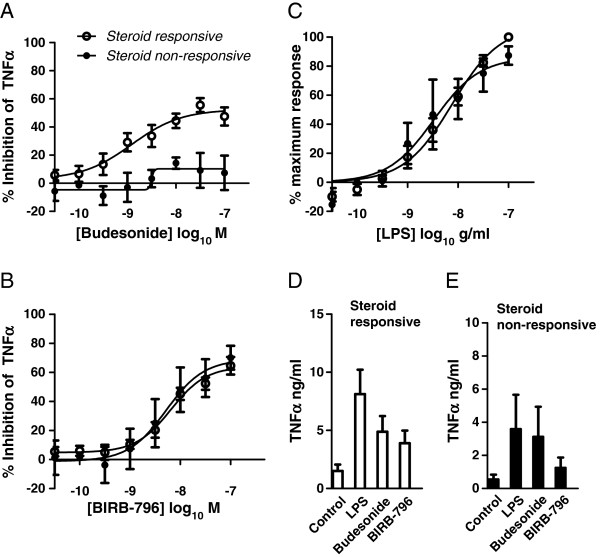
Figure 5.
The effects of Budesonide (A) and BIRB-796 (B) in COPD AMs separated into donors resistant (< 30% inhibition of LPS-induced TNFα release, n = 3), closed circles) or sensitive (> 30% inhibition, n = 8, open circles) to steroid. (C) LPS concentration-effection response curve in steroid resistant (closed circles) or steroid sensitive (open circles) COPD donors. Data is expressed as mean ± s.e. and the lines drawn through the points are the result of fitting using equations 1 (LPS data) and 2 (Budesonide and BIRB-796 data). Absolute cytokine release levels for steroid responsive (D) and steroid non-responsive (E) groups in response to LPS alone and in the presence of 100 nM Budesonide or BIRB-796.

