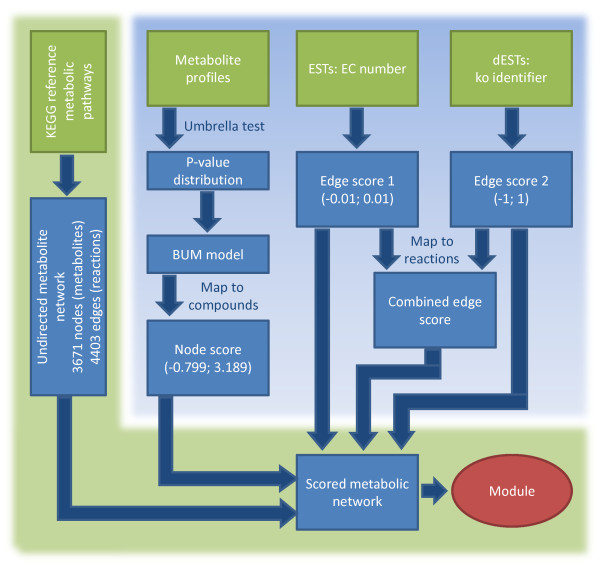
Figure 2.
Data integration. Different data sources are integrated to identify a functional module explaining the metabolic changes in Milnesium tardigradum during de- and rehydration. On the left hand side the metabolite network is created from KEGG reference pathways. On the top of the right side different sources of molecular data are integrated: the metabolite profiles and the two sets of ESTs. From these node and edge scores are derived which are subsequently used to score the metabolic network. In the last step a maximum-scoring subnetwork is calculated using the heinz algorithm.

