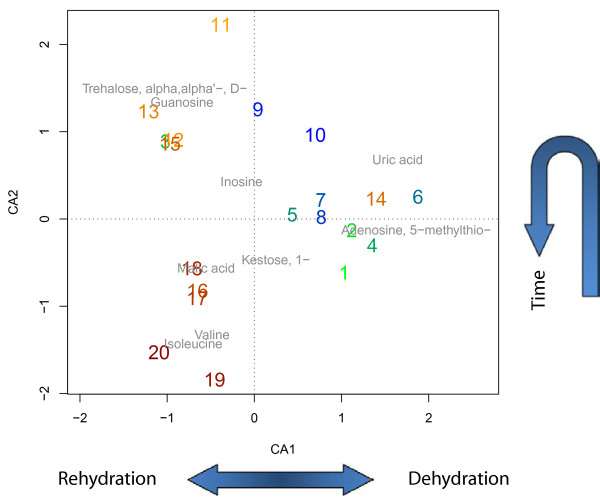
Figure 3.
Correspondence analysis. Correspondence analysis (CA) of the 10% metabolites with the largest variance out of 84 metabolic profiles measured in total. Displayed are the twenty measurement time points during dehydration (from green to dark blue) and rehydration (orange to red). The first component clearly separates the two processes (de- and rehydration), while the second component separates early and late time points.

