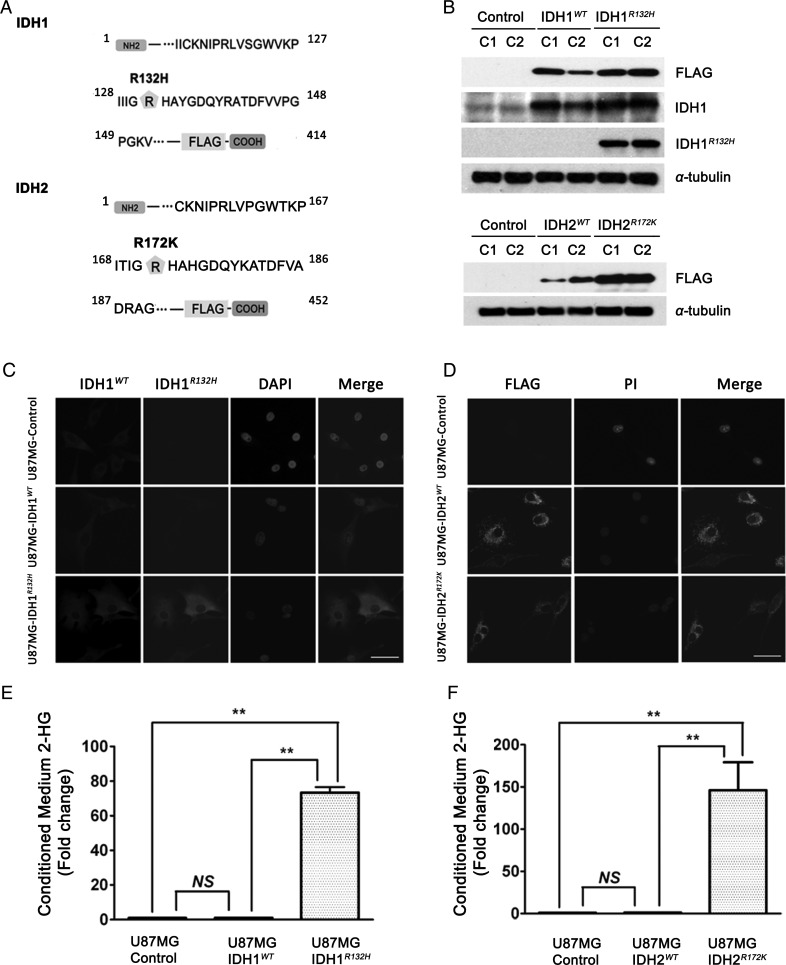
Fig. 1.
Establishment of glioma stable cell lines overexpressing IDH1WT, IDH1R132H, IDH2WT, and IDH2R172K. (A) Schematic diagram of the IDH1-FLAG and IDH2-FLAG fusion protein amino acid sequence. The FLAG tag was linked to the C-terminus of IDH1 and IDH2. Amino acid residue 132 for IDH1 and 172 for IDH2 are indicated with ( ). (B) Representative western blot for FLAG-tagged IDH1WT and IDH1R132H or IDH2WT and IDH2R172K in stably transfected U87MG cells (2 representative independent clones for each construct, C1 and C2, are shown) using anti-FLAG, anti- IDH1WT, and anti-IDH1R132H antibodies. (C) Immunofluorescence showed the diffuse cytoplasmic distribution of IDH1WT and IDH1R132H proteins stained by anti-FLAG antibody (green), anti-IDH1WT antibody (red), and anti-IDH1R132H (green). Nuclei were counterstained with DAPI (blue). 40×, bar = 20μm (D) Immunofluorescence shows the punctate cytoplasmic distribution of IDH2WT and IDH2R172K proteins stained by anti-FLAG antibody (green), and nuclei were counterstained with propidium iodide (PI) (red), 40×, bar = 20μm. (E) ∼70-fold increase in 2-HG level was found in the conditioned medium of U87MG-IDH1R132H cells by HPLC-MS. Data were normalized by cell number and expressed as fold change relative to U87MG-control (mean ± SEM, n =3). **P < .01 compared with U87MG-control and U87MG-IDH1WT cells. (F) ∼140-fold increase in 2-HG level was found in the conditioned medium of U87MG-IDH2R172K cells by HPLC-MS. Data were normalized by cell number and expressed as mean fold change relative to U87MG-control (mean ± SEM, n =3). **P < .01 compared with U87MG-control and U87MG-IDH2WT cells.

