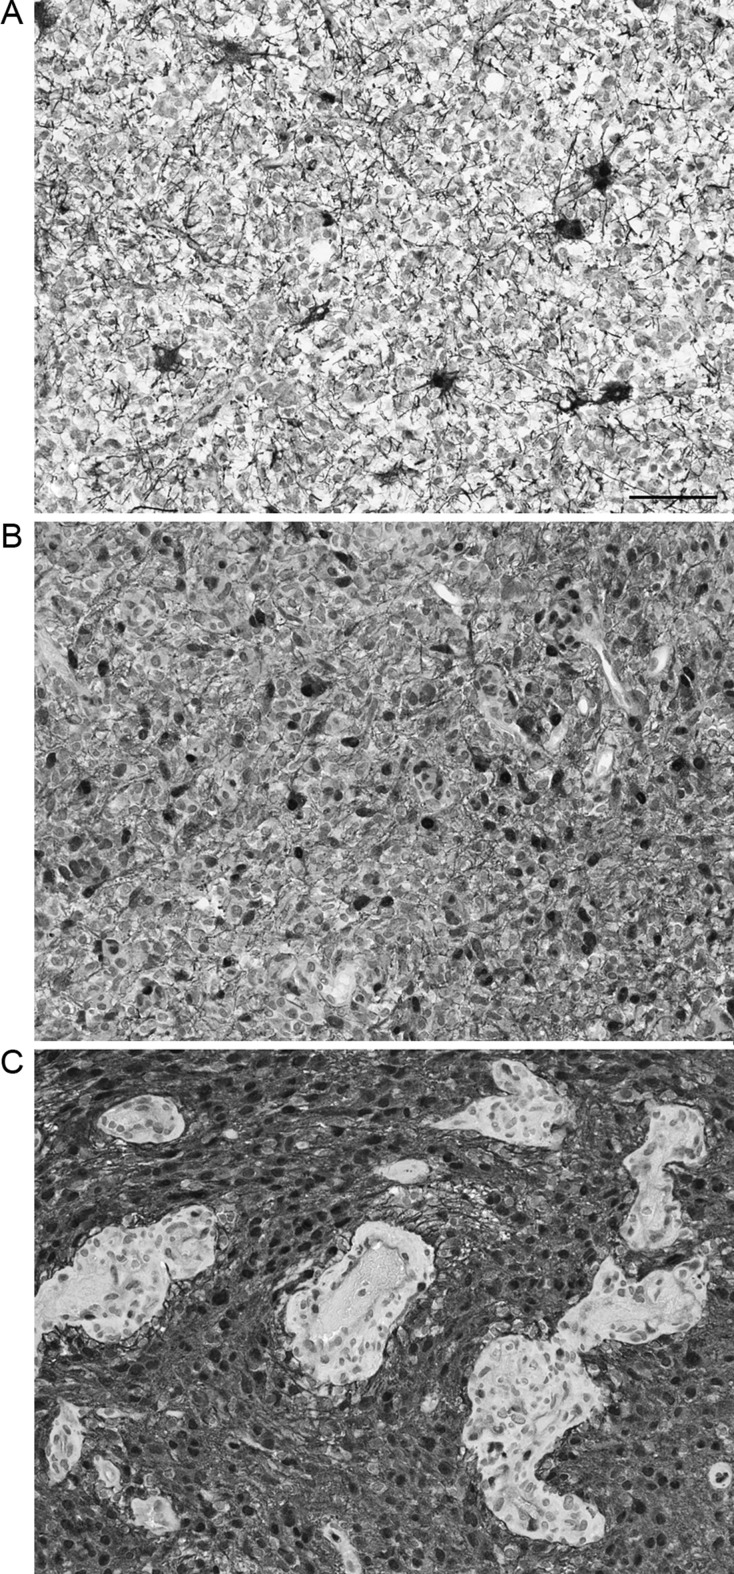
Fig. 2.
Representative images of pMAPK staining in glioblastomas. A, Low (0%–10%) category. B, Intermediate (10%–40%). C, High (>40%). Inserts show 4× enlarged representative fields. Note “starburst” appearance of reactive gliosis on A, variable staining of endothelial cells on C. Original magnification 200×. Bar: 100 μ.

