
Figure 11.
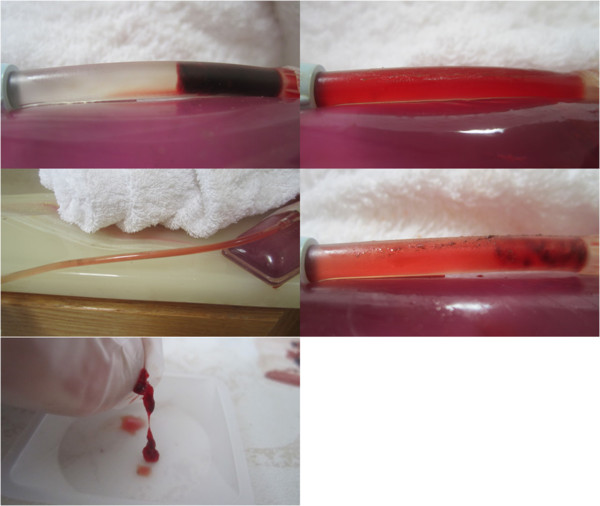
Images of SK enriched LFVP treated sample no. 9 yielding clot mobilization. Image (upper left) depicts the clot’s pre-condition with SK administered 2.5 cm from the clot interface (mixing score graded 0). Image (upper right) depicts the catheter segment following 20 minutes of “diastolic” timed LFVP. In this sample the clot migrated proximally and is hidden within the catheter’s blue connecting tip. Image (middle left) shows dissolved clot constituent mixing up into the connecting line (mixing score graded 6, Relative Mixing Score therefore +6). Image (middle right) shows the clot after being flowed back to its original position. Image (bottom) shows the collected clot sample which had not fragmented.