
Figure 6.
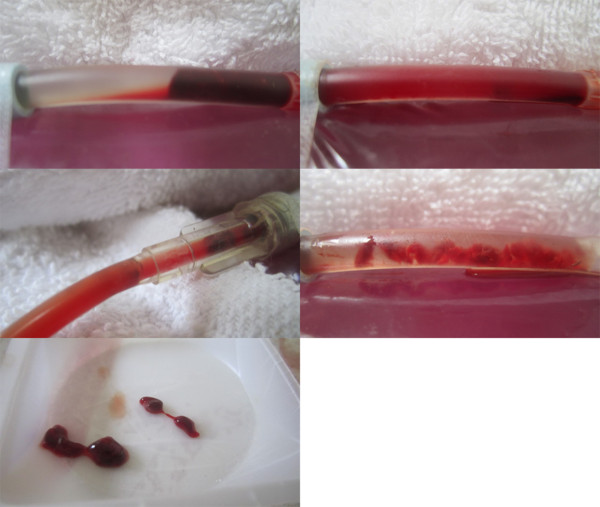
Images from LFVP sample no. 8 which led to clot fragmentation. Image (upper left) depicts the clot’s pre-condition (mixing score graded 0). Image (upper right) depicts the catheter segment following 20 minutes of “diastolic” timed LFVP (in this sample the clot migrated proximally from the catheter’s distal cap). Image (middle left) shows dissolved clot constituent mixing, including part of the clot, which had migrated up the connecting line (mixing score graded 5, Relative Mixing Score therefore +5). Image (middle right) shows the clot after being flowed back to its original position. Image (bottom) shows a sample of the expired clot which had fragmented.