
Figure 9.
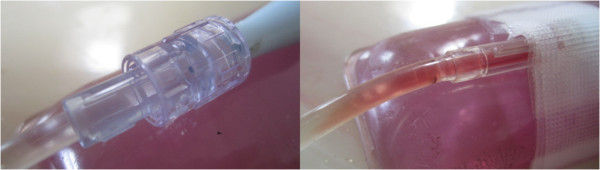
Post SK treated clot constituent mixing (Control vs. LFVP sample). Image (left) shows the typical (and again absent) degree of post treatment dissolved clot constituent mixing into the connecting line in a SK enriched control sample (from sample no. 1). Image (right) shows the comparatively pronounced mixing observed during an SK enriched LFVP application (from sample no. 15). Note the relative faintness of red color in the LFVP SK treated sample which we attributed to a lytic induced dissipation effect.