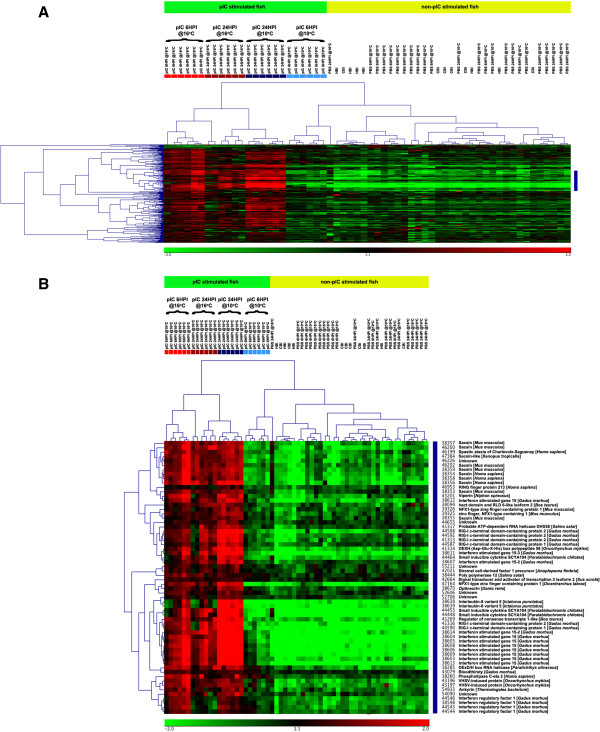
Figure 5.
Heat-map depiction of hierarchical clustering of all samples (i.e. microarrays) and the 290 genes significantly differentially expressed between pIC@10°C and pIC@16°C at 6HPI based on their mRNA expression (see Figure2). The colored boxes below the top legend of each panel (A and B) represent individual fish from the pIC injected groups at the different temperatures and time points. Light red = pIC@16°C 6HPI; light blue = pIC@10°C 6HPI; dark red = pIC@16°C 24HPI; and dark blue = pIC@10°C 24HPI. Panel A shows the complete clustering including all genes. Panel B shows only the cluster marked in blue on A, which is enriched for genes belonging to the interferon pathway.

