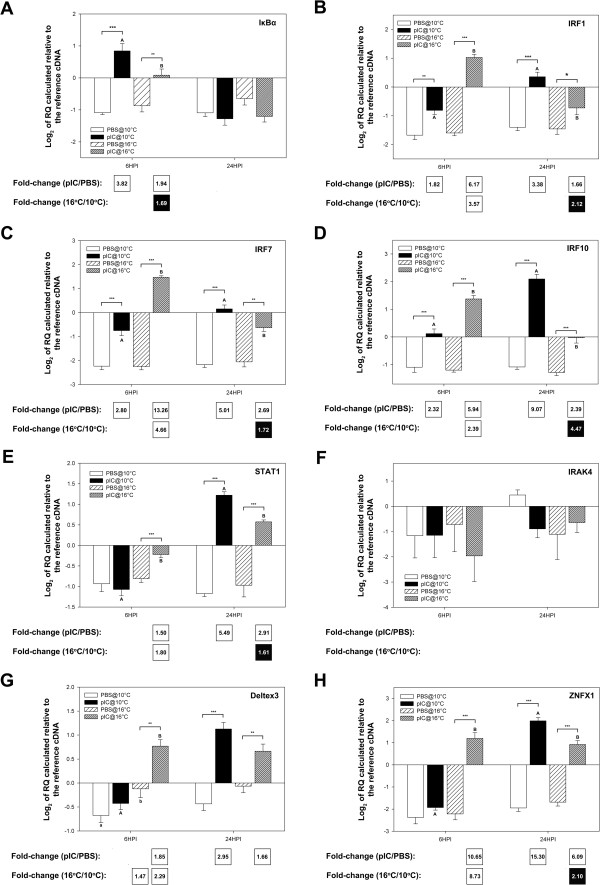
Figure 9.
QPCR results for transcripts with putative roles in signal transduction/transcription control (see Additional file 2: Figure S1 schema of the TLR/interferon pathways). Data is presented as mean log2 transformed data ± SE. Different letters represent significant differences between fish injected with pIC at different temperatures within each time point. An asterisk (*) represents a difference between a given pIC-injected group and the time- and temperature-matched PBS-injected group (* p < 0.05; ** p < 0.01; *** p < 0.001). Fold-changes in white boxes are always pIC/PBS or 16°C/10°C and are shown in the boxes beneath each panel. Only significant differences are shown. Black boxes show 1/fold-change for comparisons that yielded values less than one (for more details on fold-change calculations, refer to the methods section). For example, if white boxes (i.e. black numbers on white background) show pIC/PBS fold change then a black box (i.e. white numbers on black background) would show PBS/pIC fold change. A) IκBα; B) IRF1; C) IRF7; D) IRF10; E) STAT1; F) IRAK4; G) Deltex3; H) ZNFX1.

