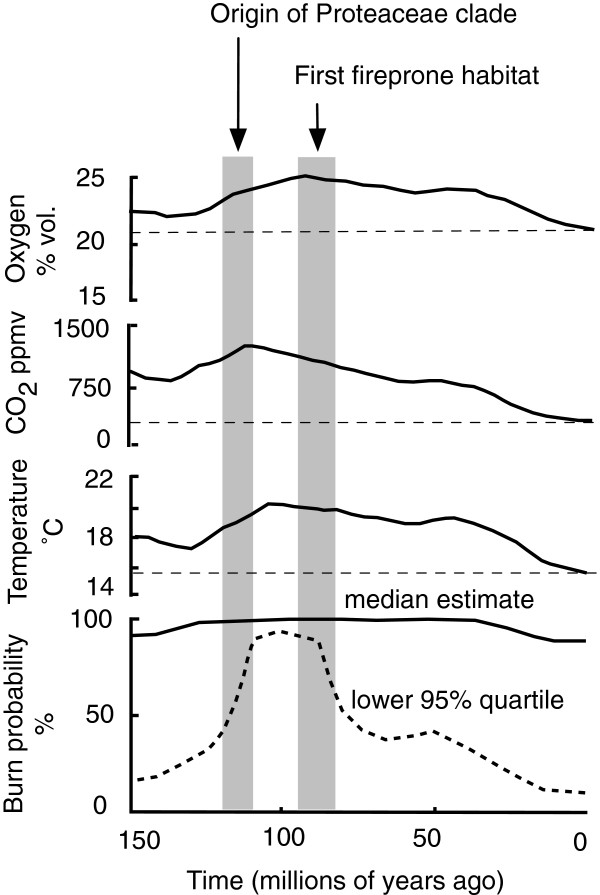
Figure 3.
Mean atmospheric conditions over the last 150 million years. From top to bottom, oxygen and carbon dioxide concentrations, annual global temperature, and ignition probability of plant matter. Broken horizontal lines correspond to ambient levels. Shaded bands correspond to the origin of the Proteaceae clade and first fireprone habitat (with 95% HPD bounds) from [12] and Figure 1a. Adapted from [1].

