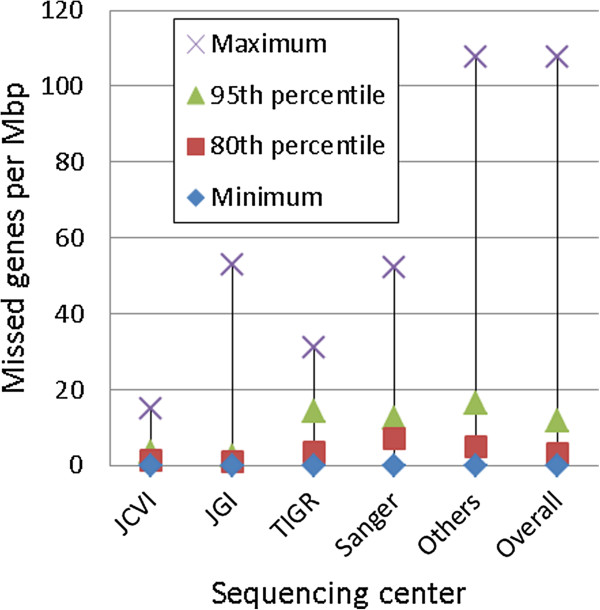
Figure 4.

Missed gene rate distributions per center. For each of the four major centers, as well as the other centers as a group, a representation of the distribution of the missed gene rates for the centers is shown. For an individual center, all chromosomes annotated by that center had their missed gene rates calculated, and the 80th and 95th percentiles are displayed along with the minimum and maximum missed gene rates.
