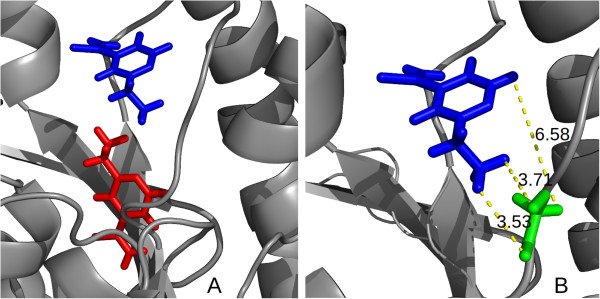
Figure 1.
Molecular docking simulation. Figure 1 is divided as follows: (A) shows an example of a docking simulation from InhA, where the protein in ribbon is depicted in gray, the ETH ligand in its initial position is highlighted in red, and the final position of ETH after a molecular docking experiment is highlighted in blue; (B) presents an example of the distances between the ETH ligand and the receptor residue GLY95 (Glycine 95).

