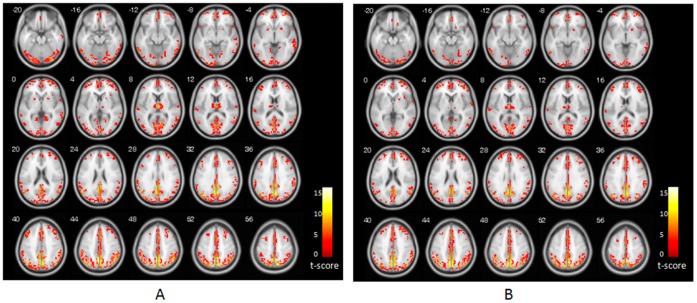
Figure 1. Results of ReHo shown as a KCC maps.
(A) ReHo map for control group. (B) ReHo map for StD group. The numbers in the upper left of each image show the z-plane coordinate of the Montreal Neurological Institute (MNI) space. T-score bar is show at right (one sample t-test, thresholded at p<0.05, corrected by FDR with an extent threshold 5 contiguous voxels).

