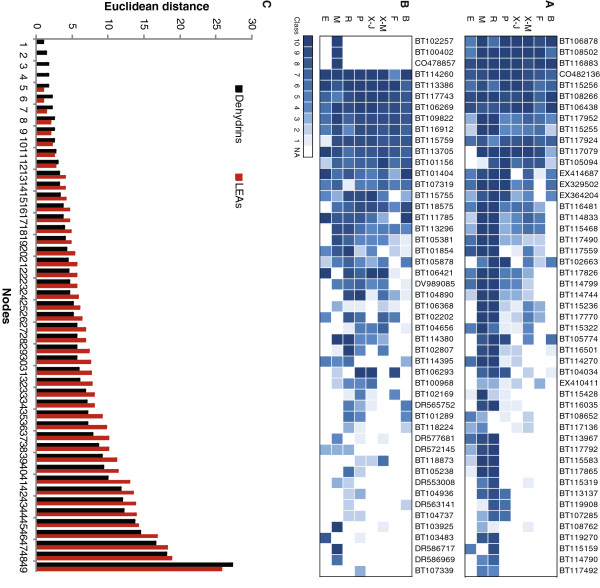
Figure 5.
Gene expression patterns in two osmotic regulation protein families based on the PiceaGenExpress database.A: Dehydrins. B: Late Embryogenesis Abundant proteins. C: Distribution of Euclidean distances between the members of each protein family. The order of the bars is not representative of the order of the genes in panels A and B. A, B: Tissues: B (Vegetative buds), F (Foliage), X-M (Xylem - mature), X-J (Xylem - juvenile), P (Phelloderm), R (Adventitious roots), M (Megagametophytes), E (Embryogenic cells).

