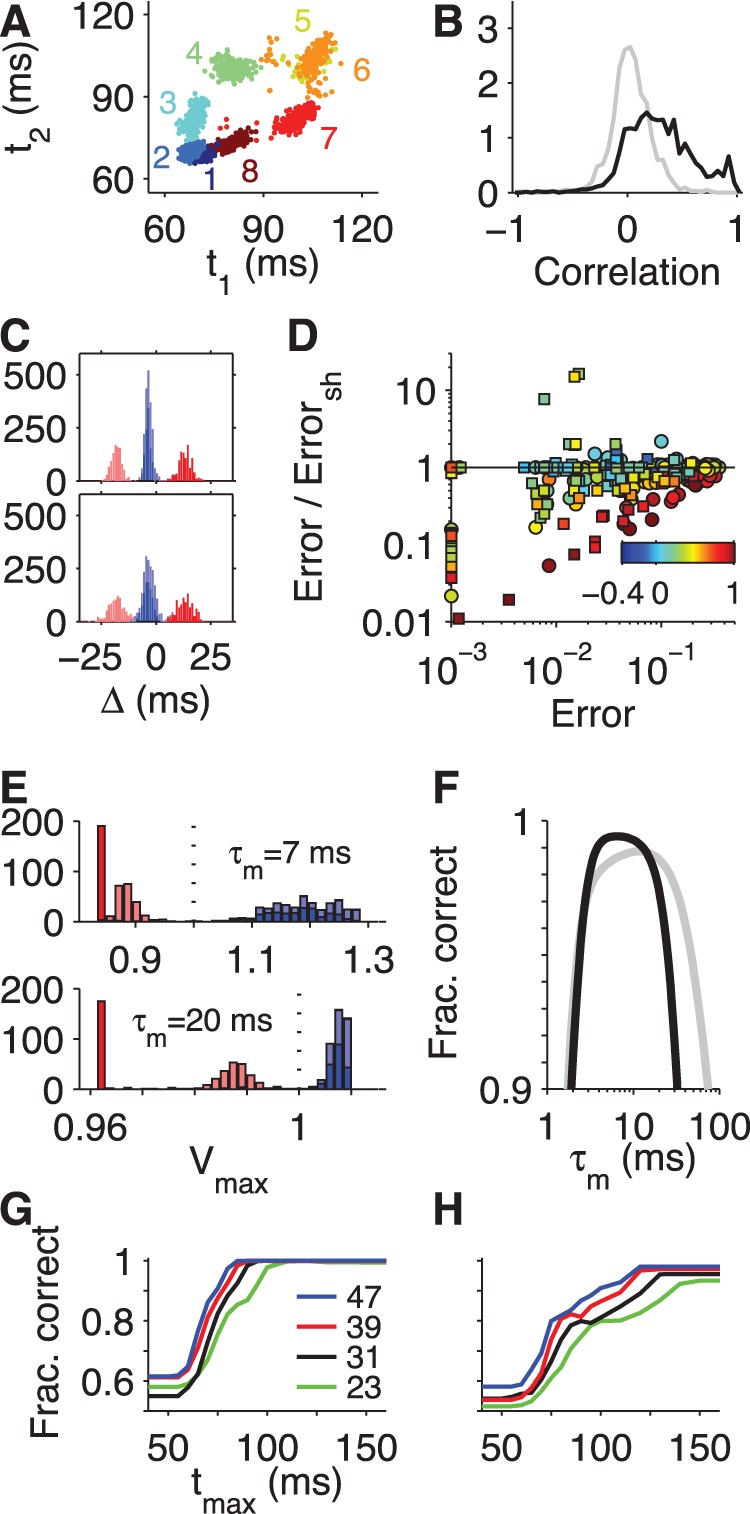
Figure 6. Effects of spike-time noise, threshold noise, and readout time on tempotron performance.

(A) Scatterplot of first-spike latencies of two RGCs on multiple trials for each of the eight stimulus phases in the highest contrast condition. For this cell pair, the latencies covary, with an average correlation coefficient of 0.46 over all eight grating phases. (B) Histogram of correlation coefficients for first-spike latencies observed for all simultaneously recorded cell pairs, stimuli, and contrasts (black). Note the excess of positive correlations. As a control, the gray line shows the analogous histogram obtained when correlating latencies of the two cells separated by one stimulus trial. (C) Top, histogram of relative latencies for the cell pair of (A) for the boundary task of Figure 4C2. Bottom, the same histogram of relative latencies, but obtained from shifted trials. Note the increased dispersion of the relative latencies and the increased overlap between the red and blue peaks. (D) Effect of latency correlations on readout performance. For all simultaneously recorded cell pairs, we obtained the minimal tempotron error rates with inputs from simultaneous trials and with inputs from shifted trials. The ratio of these two error rates is plotted against the error rate obtained for simultaneous trials. Squares: luminance task; circles: boundary task. Symbol colors represent the mean latency correlation across the four stimuli that constitute a given task (color bar). Note that most of the points lie below unity, showing that in most cases the readout performance degrades when trials are shifted and latency correlations destroyed. (E) Distributions of the peak voltage of the tempotron for the boundary task, based on the distributions of relative latencies shown in (C) (top; same color code). The two voltage distributions result from optimizing the tempotron weights for different PSP kinetics, namely  (top) and
  (bottom). In this example the shorter PSPs generate a much larger separation between the maximal voltages for target and null stimuli (red vs blue), such that the spike readout would be more robust to any noise in the neuron’s threshold. (F) Optimal classification performance on the boundary task with the input cell pair of (C) and assuming a Gaussian threshold noise whose standard deviation is 5% of the mean synaptic weight magnitude. The error was minimized for each PSP time constant (x-axis) over the synaptic efficacies for the purely excitatory solution (black, Figure 4D2) and the mixed solution with one excitatory and inhibitory input (gray, Figure 4E2). (G) Performance of optimal tempotrons operating with a pair of RGCs on the luminance task as a function of the maximal allowed latency,
  , of input spikes. The fraction of correct classifications was averaged over all input cell pairs that allowed for error-free performance in the highest contrast condition at large
  . Results are plotted for different values of the stimulus contrast (indicated in %). (H) As in (G) but for the boundary task and the fraction of correct classifications averaged over all input cell pairs with errors below 5% in the highest contrast condition at large
  .
.
