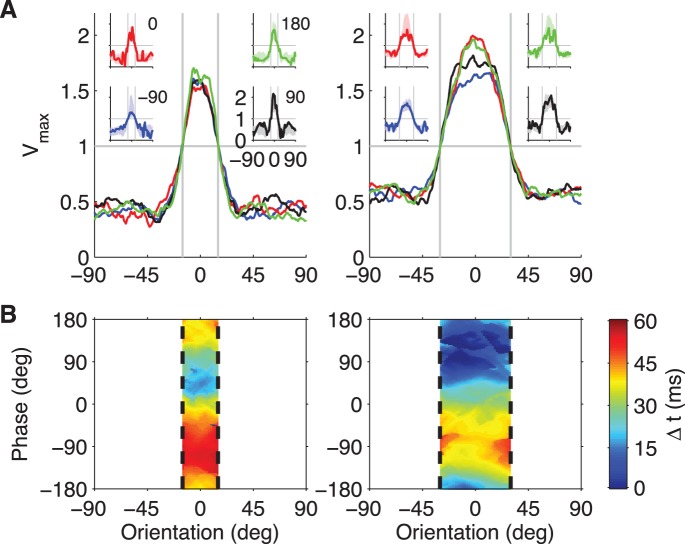
Figure 8. A tempotron model for orientation tuning with phase invariance.
(A) Orientation tuning curves of a tempotron model designed to show phase invariance. Extending the schematic model shown in Figure 7, this tempotron received inputs from 200 model RGCs whose Gaussian receptive fields were randomly placed in the circular region over which the grating was presented. The latency of each RGC was cosine-tuned to the fraction of its receptive field covered by dark grating bars as in the experimental recordings (Figure 1). The tempotron was trained to fire in response to orientations within ±15° (left) or ±30° (right) independently of the grating phase. The curves show average orientation tuning curves of the maximal voltage for four different grating phases (–90°: blue, 0: red, 90°: black, and 180°: green). Averages were obtained over 14 (left) and 15 (right) independent RGC populations and tempotrons. For each tuning width, insets show the four orientation tuning curves of one individual tempotron, overlaid on the mean ±1 standard deviation of the populations (shaded areas). (B) Spike timing of the two tempotron models shown in the insets of (A) with narrow (left) and wide (right) orientation tuning. The latency of the output spike (color code) was measured relative to the shortest-latency spike of the tempotron and plotted as a function of orientation and phase of the stimulus grating. Each tempotron spiked only for orientations within the dashed vertical lines.

