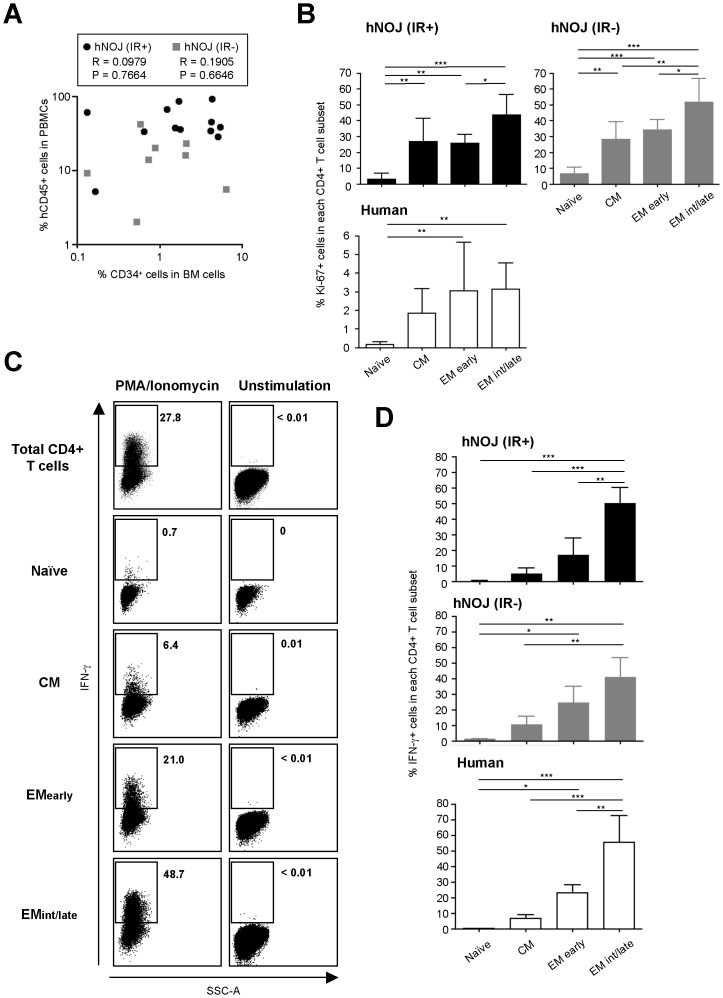
Figure 5. Possible occurrence of HSP of CD4+ T Cells in hNOJ mice.
(A) Association between the percentage of hCD45+ cells within the PBMC population and that of CD34+ cells in the BM cells from hNOJ (IR+) and hNOJ (IR−) mice at ≥16 wk post-transplantation (n = 12 and n = 8, respectively). Spearman’s rank correlation coefficient was used for statistical analysis. (B) Percentage of Ki-67+ cells among naïve, CM, EMearly, and EMint/late subsets of splenic CD4+ T cells from hNOJ (IR+) and hNOJ (IR−) mice at ≥16 wk post-transplantation (n = 6 and n = 6, respectively) and from human PBMCs (n = 10). Data are expressed as the mean ± SD. Significant differences (* P<0.05, ** P<0.01, *** P<0.001) were determined by Tukey’s multiple comparison test. (C and D) Ex vivo IFN-γ production by CD4+ T cells after stimulation with PMA/ionomycin. CD4+ T cells were prepared from the spleens of hNOJ (IR+) and hNOJ (IR−) mice at ≥16 wk post-transplantation or from human PBMCs. (C) Representative flow cytometry profiles showing the proportion of IFN-γ+ cells within each of the CD4+ T cell subsets from a hNOJ (IR+) mouse at 16 wk post-transplantation. (D) Cumulative data showing the percentage of IFN-γ+ cells within each of the CD4+ T cell subsets from hNOJ (IR+) and hNOJ (IR−) mice and humans (n = 3, n = 3, and n = 4, respectively). Data are expressed as the mean ± SD. Significant differences (* P<0.05, ** P<0.01, *** P<0.001) were determined by Tukey’s multiple comparison test.

