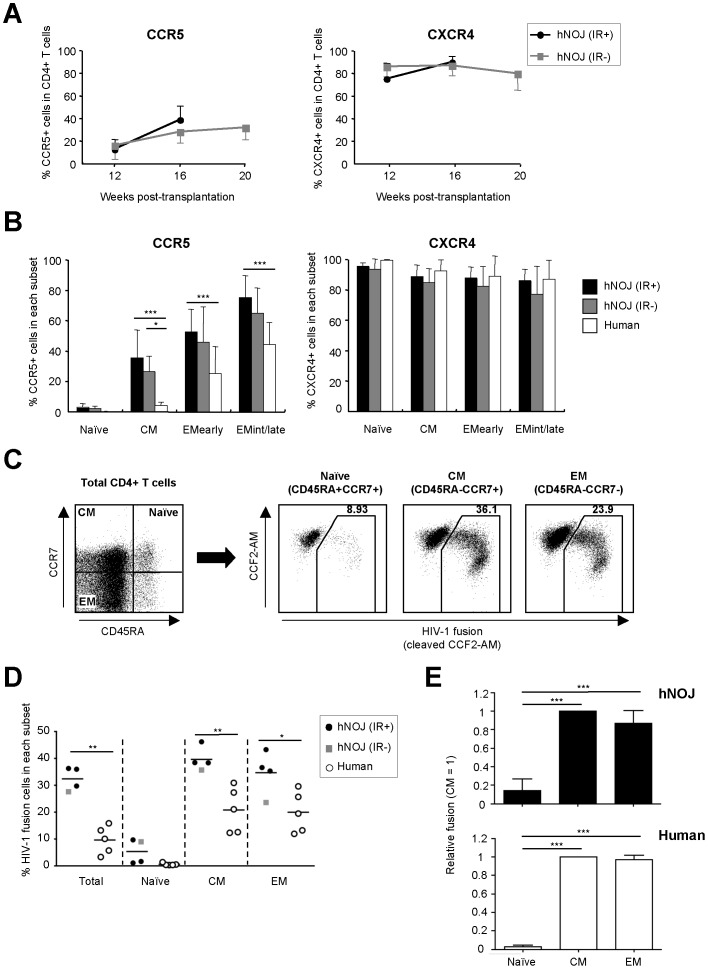
Figure 6. HIV-1 co-receptors, CCR5 and CXCR4, expression profiles and ex vivo R5 HIV-1 infectivity of CD4+ T Cells in hNOJ mice.
(A) Changes in the percentage of CCR5+ (left) and CXCR4+ (right) cells within the peripheral blood CD4+ T cell population isolated from hNOJ (IR+) and hNOJ (IR−) mice (n = 18 and n = 6, respectively). Data are expressed as the mean ± SD. (B) Percentage of CCR5+ and CXCR4+ cells within the naïve, CM, EMearly, and EMint/late subsets of peripheral blood CD4+ T cells isolated from hNOJ mice at 16 wk post-transplantation (n = 18 and n = 6, respectively) and from humans (n = 5). Data are expressed as the mean ± SD. Significant differences (* P<0.05, *** P<0.001) were determined by two-way factorial ANOVA with the Bonferroni multiple comparison test. (C, D, E) Fusion assay using R5 HIV-1 and CD4+ T cells. Splenic CD4+ T cells from hNOJ mice at ≥17 wk post-transplantation (n = 4; three hNOJ (IR+) mice and one hNOJ (IR−) mouse) or peripheral blood CD4+ T cells from humans (n = 5) were infected ex vivo with HIV-1NL-AD8-D-BlaM-Vpr. (C) Naïve, CM, and EM subsets of CD4+ T cells (gated on CD3+CD4+CD8−) were defined as CD45RA+CCR7+, CD45RA−CCR7+, and CD45RA−CCR7−, respectively, by flow cytometry. (D) Percentage of R5 HIV-1 fusion cells within the total CD4+ T cell population and within the naïve, CM, and EM subsets in hNOJ mice and humans. Individual data points are plotted. The black lines represent the mean. Significant differences (* P<0.05, ** P<0.01) were determined by the unpaired t test. (E) Relative ratio of R5 HIV-1 fusion among the naïve, CM, and EM subsets from hNOJ mice and humans. The level of R5 HIV-1 fusion in each of the CD4+ T cell subsets relative to that in the corresponding CM subset. Data are expressed as the mean ± SD. Significant differences (*** P<0.001) were determined by Tukey’s multiple comparison test.

