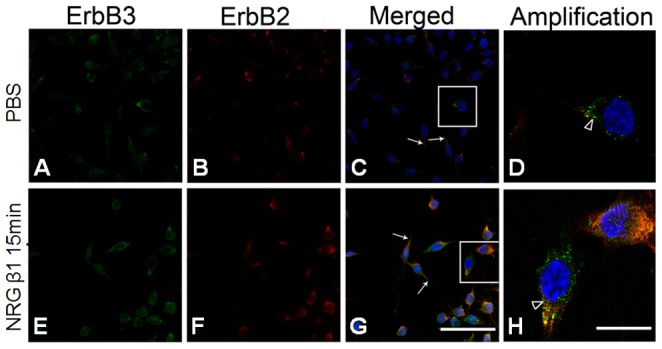
Figure 1. Confocal photomicrographs showing erbB2 (red) and erbB3 (green) receptor expressions in the culture RSC96 cells following phosphate buffer saline (PBS) (A–D) and neuregulin β1 (NRG β1) treatment (E–H).

The cell nucleus was stained by DAPI (blue). Note that in both PBS and NRG β1 treatment groups, the erbB2 and erbB3 immunoreactivities were present in cell membrane and cell processes (arrows in C, G). However, after NRG β1 treatment (10nM) for 15 minutes, more RSC96 cells (G) with erbB2 and erbB3 co-localization (yellow) in the perinuclear area [arrowhead in (H) showing high magnification of rectangles labeled in (G)] was observed than that of PBS group (C,D). Scale bar = 20 µm in (A, B, C, E, F, G) and represents 5 µm in (D, H).
