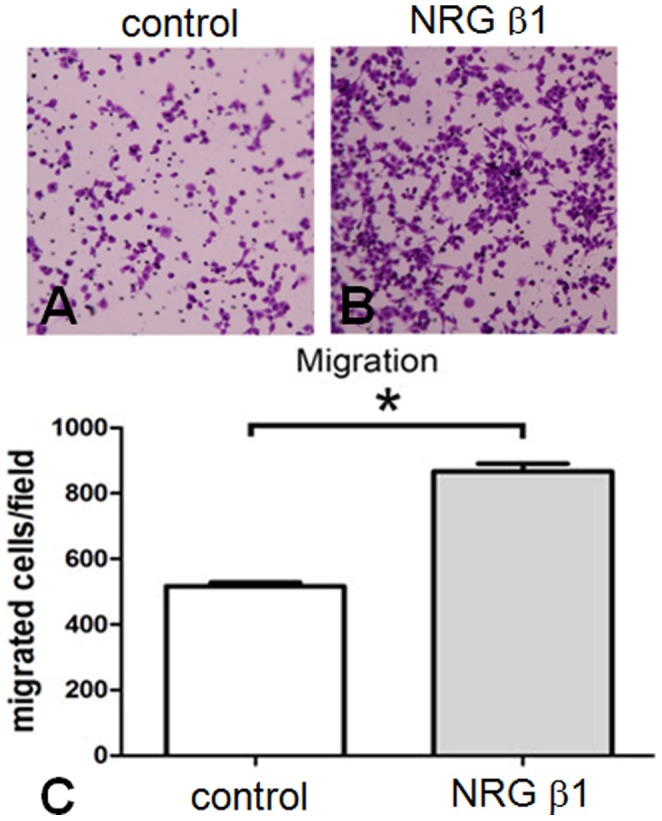
Figure 3. Photomicrographs (A, B) and histogram (C) showing the cell migration assay in culture RSC96 cells following phosphate buffer saline (PBS, control) and neuregulin β1 (NRG β1) treatment.

The extent of cell migration was assessed by the Boyden chamber system. Note that numerous migrated cells stained with crystal violet were observed in NRG β1 group (B) as compared with that of PBS control ones (A). Also note that similar findings were detected by quantitative counting in which NRG β1 promotes more cell migration than that of PBS control group (C). *P<0.05 as compared to that of control value.
