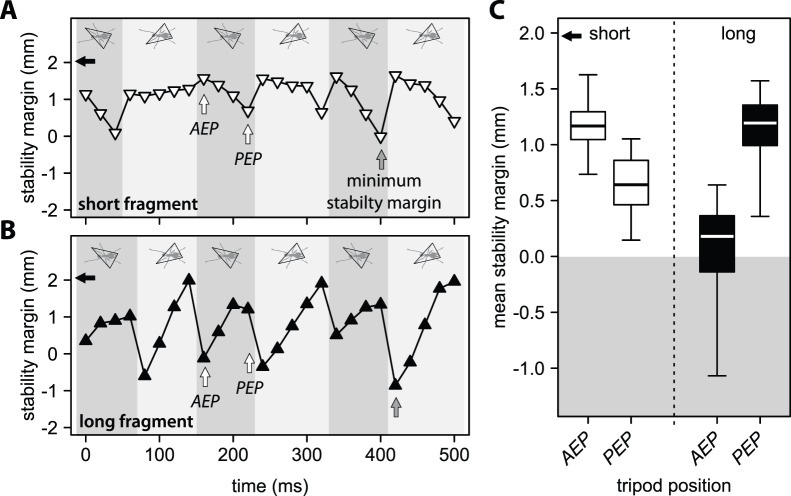
Figure 4. Variation of tripod stability margin during three full strides for an ant carrying A) a short and B) a long fragment.
Diagrams at the top of the graphs illustrate the supporting tripod. White arrows indicate the anterior (AEP) and posterior (PEP) extreme positions of a tripod during one step. The minimum stability margin during the three full strides is indicated with a grey arrow. Black arrows show the maximum possible stability margin. C) Mean stability margin for tripods in their anterior and posterior extreme positions during three full strides for ants that carried short and long fragments. The black arrow indicates the mean maximum stability margin. Box plot shows medians (centre lines) and inter quartile ranges (boxes); whiskers indicate the highest and lowest values.

