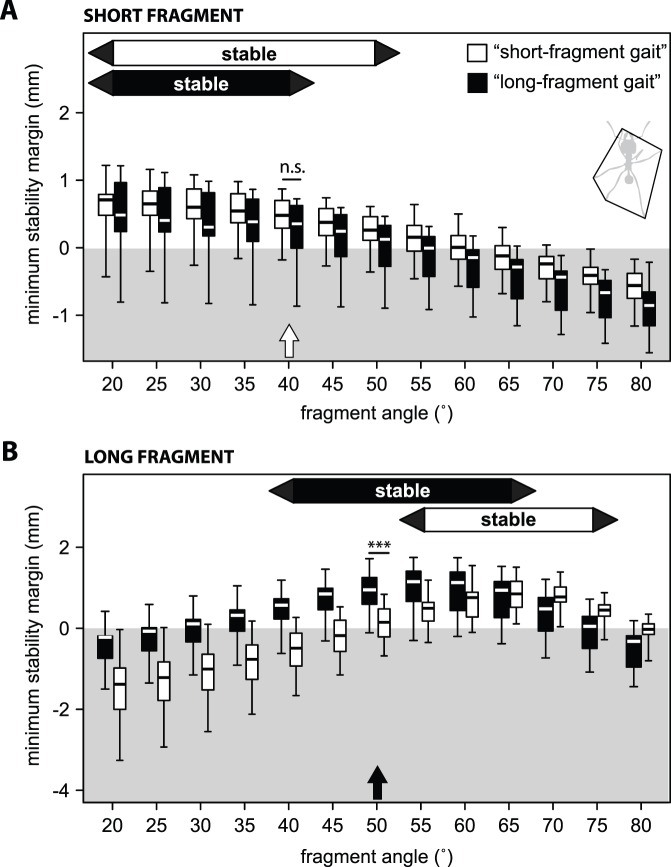
Figure 6. Stability margins of ants carrying A) short and B) long fragments calculated for different fragment angles.
The white box plots show the result for ants assumed to move with the gait of ants with short fragments; black box plots show the result for ants assumed to move with a “long fragment gait”. The white arrow indicates the actual mean fragment angle of ants that carried short fragments and the black arrow the one for ants with long fragments. Box plot shows medians (centre lines) and inter quartile ranges (boxes); whiskers indicate the highest and lowest values. Asterisks indicate significance levels (***: p<0.001).

