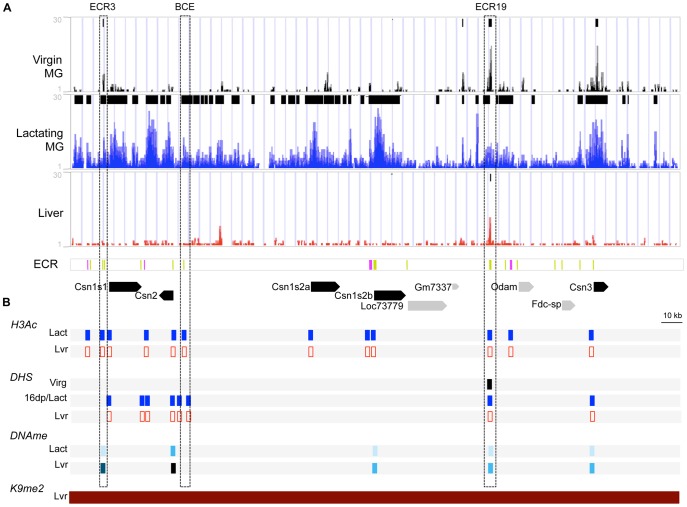
Figure 2. Chromatin markers in the casein gene cluster region in different tissues and developmental stages.
This illustration is a close-up of the CSN region from Figure 1. (A) ChIP-seq reads for H3K4me2 in MEC isolated from virgin mammary glands at 12 weeks of age, staged at diestrus (Virgin MG, black), in lactating mammary glands (Lactating MG, blue) and in liver tissue (Liver, red). A summary of peaks identified by MAC and SICER are at the top of each of the Virgin MG, Lactating MG, and Liver panels. In the evolutionary conserved region (ECR) panel, ECRs are shown in green; ECR1, 6 16 and 21 are indicated in pink. In the bottom panel, the locations of the casein genes (black) and non-casein genes (gray) are indicated by solid arrows denoting the direction of transcription. (B) Summary of markers of epigenetic regulation in the CSN region. (H3Ac) Summary of results of ChIP for H3-acetylation on lactating mammary gland (Lact, blue) and liver tissue (Lvr, red). Sites investigated are indicated by rectangles: filled rectangles, H3AC enriched; open rectangle, non-enriched (See figure S3). (DHS) Summary of DNaseI Hypersensitivity analysis in MEC isolated from from virgin mammary glands at 12 weeks of age, staged at diestrus (Virg, black), in lactating mammary gland (Lact, blue) and liver tissue (Lvr, red). Sites investigated are indicated by rectangles: filled rectangle, DHS; open rectangle, non-DHS (see Fig. S4). (DNAme) Summary of results of DNA methylation analysis on lactating mammary gland (Lact) and liver tissue (Lvr) (see also Fig. 5). Levels of DNA methylation are based on Fig. 5A and Table S2 and are color coded as follows: 0–20% lightest blue, 21–40% light blue, 41–60% blue, 61–80% dark blue and 80–100% black; open rectangles: not analyzed. (K9me2) Summary of ChIP-chip for H3K9me2, a histone modification associated with closed chromatin, on liver tissue from [62]; red filled rectangle indicates enrichment of H3K9me2 in liver tissue.

