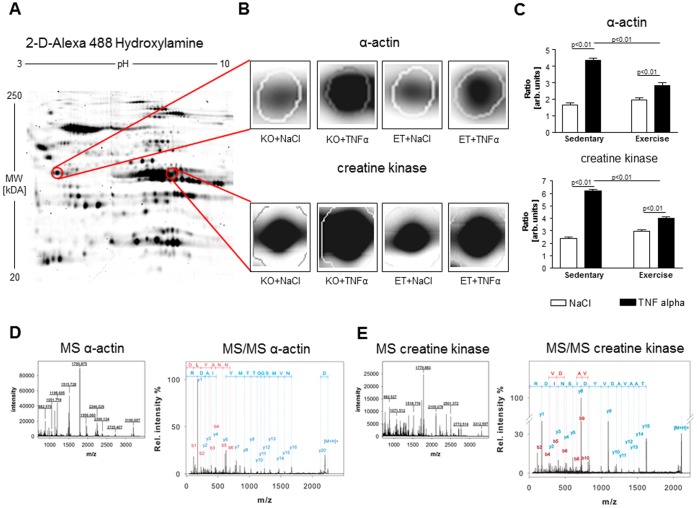
Figure 4. 2-D gel electrophoresis (A) revealed 2.6-fold increase in carbonylated α-actin and carbonylated CK, depicted as a ratio of carbonylated α-actin to total α-actin or carbonylated CK to total CK, respectively.
Exercise training diminished the carbonylation of α-actin and CK (B and C). In D and E the results of the MALDI TOF analyses are depicted confirming that the spots are α-actin and CK. KO = sedentary mice, ET = exercised mice. Sedentary+NaCl n = 7, Sedentary+TNF- α n = 8, Exercise+NaCl n = 8, Exercise+TNF- α n = 7.

