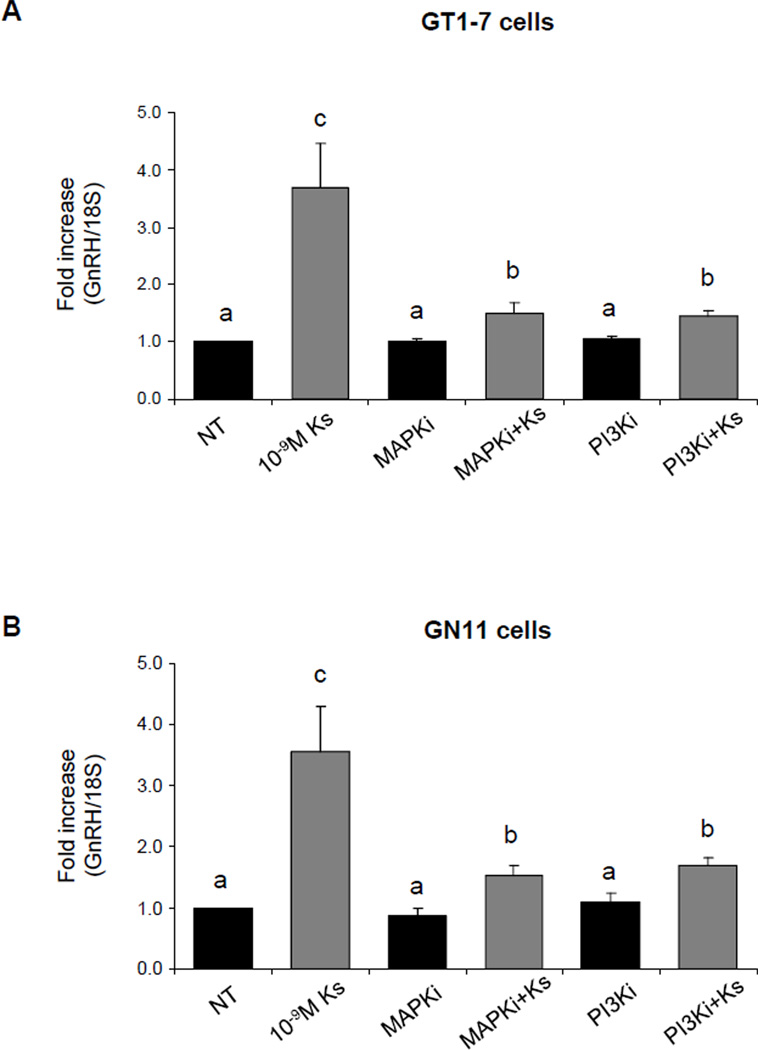
Figure 5. GnRH mRNA expression in GT1-7 cells treated with kisspeptin, MAPK inhibitor and PI3K inhibitor (quantitative RT-PCR).
(A) GT1-7 and (B) GN11 cells. Graphic representation of the means±SE of relative mRNA levels graphed as fold increasing of levels relative to non-treated cells. Cells were treated with 10−9M kisspeptin (Ks 10−9M), 10µM MAPK inhibitor or 50µM PI3K inhibitor. And co-treated with Ks 10−9M+MAPKi or Ks 10−9M+PI3Ki. There is no statistical difference between groups with the same letters (n=4–6, P ≤0.05; ANOVA followed by Newman–Keuls test).

