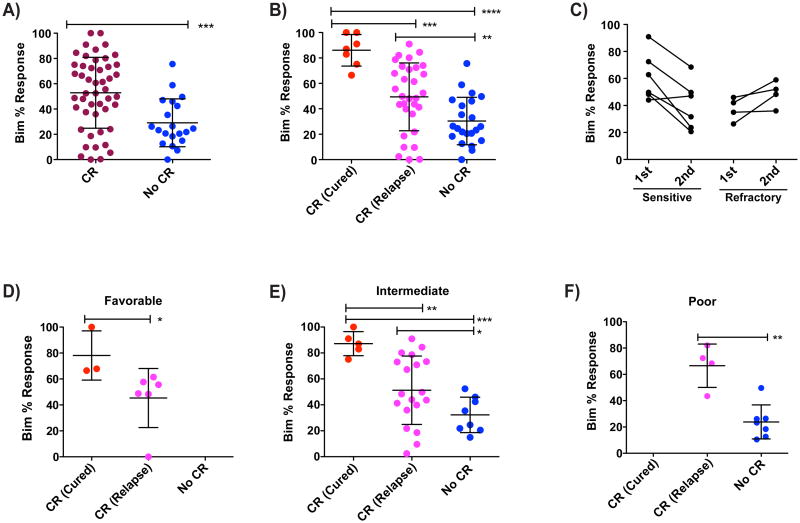
Figure 4. Relative priming of AML determines clinical outcome.
(A) Pre-induction priming as measured by Bim 0.1 μM depolarization of patient AML samples compared with clinical response to induction therapy specified as CR (complete response) or no CR. (B) Patients who achieve CR are separated into Cured (no relapse and no transplantation) or Relapse (relapse after initial CR). Highly primed patients having better clinical outcome. (C) Sequential samples were obtained from the same patients at two different dates. Patients who were initially obtained a CR and then relapsed and patients who never achieved a CR and had a second biopsy taken after induction. Decrease in priming for after relapse is statistically significant based on a one-tailed Wilcoxon matched-pair signed rank test with p-value 0.03. No such significant trend was observed for the refractory sequential samples. (D-F) Patients were grouped based on their ELN relapse risk factors and clinical outcome was compared with priming of primary AML samples. Patients with normal cytogenetics lacking NPM1 and FLT3 information were classified as Intermediate Risk. Significant differences were calculated using a nominal one-tailed Mann-Whitney test. (* p-value < 0.05, ** p < 0.005, *** p < 0.0005). See also Figure S3 and Table S2.

