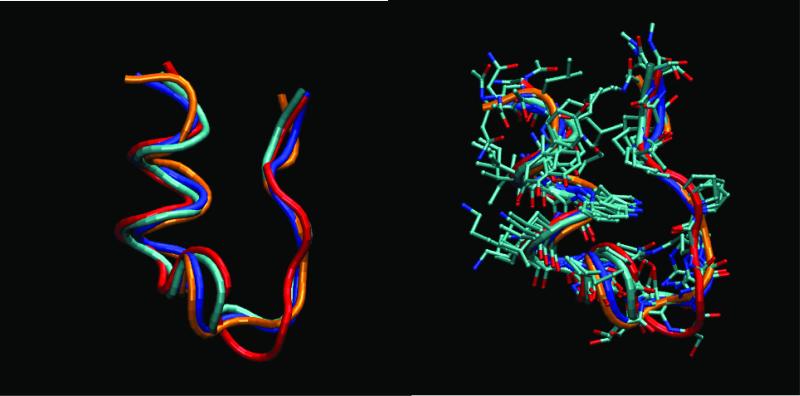
Figure 3. Superposition of representative structures belonging to the folded basins. Four representative structures are obtained by clustering the structures sampled at the lowest temperature (280K), during the last 10 ns of the REMD simulation.
The top most populated clusters correspond to structures at 0.075 nm (48%), 0.69 nm (7%), 0.15 nm (6%), 0.17 nm (5%), and 0.21 nm (4%) from structure 1 of the NMR ensemble. Cluster 2 is assigned as an unfolded state. The plots show the superposition of the structures in the folded basin (rmsd < 0.22 nm). We used the Daura clustering method implemented in Gromacs48. A) Tube representation of the backbone. B) All non hydrogen atoms. The structures representative of the top four clusters in the folded basins are labeled in cyan first cluster), blue (third cluster), red (fourth cluster), and orange (fifth cluster). The main differences in the structures are in the 3-10 turn (Pro 12- Ser13-Ser-14-Gly15) region and the N and C termini.

