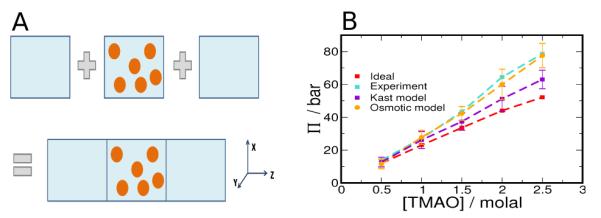
Figure 1.

Osmotic Pressure of TMAO solutions. (A) The schematic illustrates the simulation method described in the text. Water, the primary solvent is shown as a blue background and the cosolvent molecules, shown as orange spheres, are confined to the central region using a restraining potential. (B) The osmotic pressure of TMAO using the new parameters (orange) is shown in contrast to the Kast model (indigo), ideal solution (red) and experimental (cyan) values.
