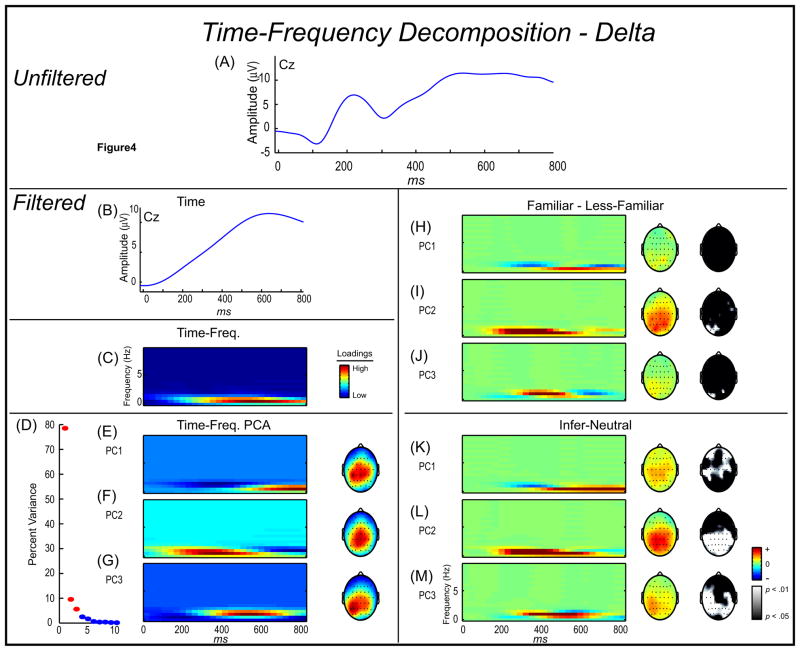
Figure 4.
Time-frequency (TF) decomposition: Delta. (A) Grand average waveform plotted at Cz. (B-G) TF-PCA decomposition of delta low pass filtered data. (H-M) Delta time-frequency condition differences: Time-frequency surfaces and headmaps are plotted with a midpoint of 0, red reflecting a positive difference, and blue reflecting a negative difference. (B) Delta filtered (below 2 Hz) grand average ERP time-domain waveform. (C) TF grand average of the delta filtered data. (D) Scree plot of singular values which was used to determine a three factor delta solution (red circles depict extracted components that account for 93.69% of the variance). (E) TF delta principal component 1, reflecting post N400 delta activity (e.g., delta activity concomitant with the P300). (F) TF delta principal component 2, reflecting delta activity corresponding to the initial N400 negativity. (G) TF delta principal component 3, reflecting post N400 delta activity (using regression analysis, this TF component was linked to the P600). (H) Largely non-significant differences in activation for delta component 1 between familiar and less-familiar condition. Topographical depiction of mean theta activation differences (amplitude and statistical maps) between familiar and less-familiar conditions. (I) Largely non-significant differences in activation for delta component 2 between familiar and less-familiar condition. (J) Largely non-significant differences in activation for delta component 3 between familiar and less-familiar condition. (K) Sparsely significant differences in activation for delta component 1 between inferred and neutral condition. (L) Significant differences in activation for delta component 2 between inferred and neutral condition. (M) Significant differences in activation for theta component 3 between inferred and neutral condition.

